Gross vs Net Plant Efficiency and Station Service Ratio
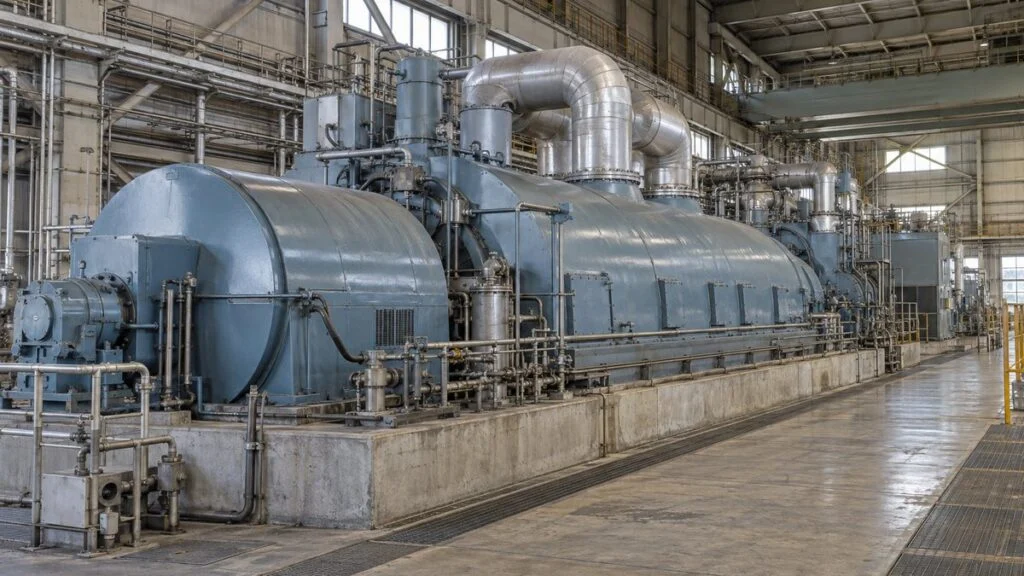
A performance data sheet from a Japanese boiler or turbine supplier lists two efficiencies: 発電端効率 and 送電端効率. A third line gives 所内率 as a percentage. Your contract, meanwhile, guarantees a net heat rate in Btu/kWh, and your O&M team tracks auxiliary power consumption every month.
The terms map cleanly once you know them. 発電端 (hatsudentan, "generating end") is gross output at the generator terminals. 送電端 (sodentan, "sending end") is net output after the plant's own consumption. 所内率 (shonai-ritsu) is the station service ratio, also called the auxiliary power ratio, and it links the two.
This guide explains where each value is measured, how to convert between gross and net efficiency and heat rate, and why the heating-value basis (HHV or LHV) matters as much as the boundary. It ends with a checklist and a list of questions to send to the Japanese side.
Here are the Japanese terms you are most likely to see on specifications, performance guarantees, and operating reports.
| Japanese | Reading | Common English equivalent | Meaning |
|---|---|---|---|
| 発電端 | hatsudentan | Generating end, gross | Electricity at the generator terminals |
| 送電端 | sodentan | Sending end, net | Gross output minus the plant's own consumption |
| 所内率 | shonai-ritsu | Station service ratio, auxiliary power ratio | Plant's own consumption as a percentage of gross generation |
| 所内電力 / 所内消費電力 | shonai denryoku / shonai shohi denryoku | Station service power, auxiliary power | Electricity used to run the plant |
| 補機 | hoki | Auxiliaries, auxiliary equipment | Pumps, fans, and other equipment that support generation |
| 受電端 / 需要端 | judentan / juyotan | Receiving end, end-use point | Where the customer receives the electricity |
| 高位発熱量 / 低位発熱量 | koi / tei-i hatsunetsuryo | HHV (GCV) / LHV (NCV) | Higher and lower heating value of the fuel |
Contents
- Generating End vs. Sending End: Where Each Is Measured
- Gross vs. Net Efficiency: A Worked Energy Balance
- Formulas: Gross Efficiency, Station Service Ratio, and Net Efficiency
- From Efficiency to Heat Rate: kJ/kWh, Btu/kWh, kcal/kWh
- HHV vs. LHV: Check the Basis Before You Compare
- Receiving End: Losses Beyond the Plant
- How Cutting Auxiliary Power Raises Net Efficiency
- Checklist: Reading Gross and Net Figures in a Japanese Spec
- Questions to Ask the Japanese Supplier
- Limits of This Guide
- FAQ
- Sources
Generating End vs. Sending End: Where Each Is Measured
The generating end is the point where power leaves the generator terminals. The sending end is the plant's net output: what is left after the station's own consumption, sent out to the grid or to the site. It is the boundary for judging the plant as a whole.
The figure below uses relative numbers. Of 30 units generated, the plant uses 3, so 27 leave through the sending end.
Figure 1: Generator Output Splits Between the Plant and the Grid
If the plant uses 3 of the 30 units at the generating end, 27 remain at the sending end.
Relative numbers for illustration. Actual metering points and loss boundaries follow each plant's metering specification.
A power plant needs electricity to run itself. Feedwater pumps and draft fans, for example, move water and combustion air into the boiler, and the power they draw comes out of what the plant can send out.
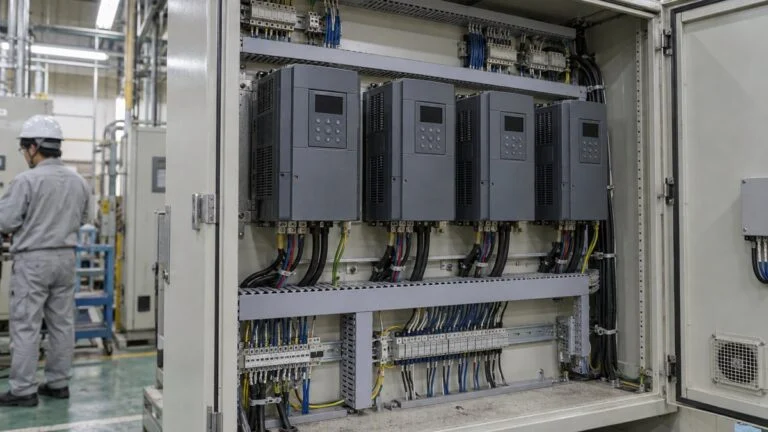
This supporting equipment is called hoki (補機, auxiliaries), and its consumption makes up station service, also called auxiliary power consumption or house load. Looking at the generator alone gives the generating-end value. Looking at the whole plant, auxiliaries included, gives the sending-end value.
What Counts as Station Service Load
In a steam power plant, the typical station service loads are the machines that move water, air, and cooling water. Plants with cooling towers also run tower fans and circulating water pumps, so the mix of loads depends on the cooling system.
The three groups below account for the work that auxiliary power does.
Figure 2: Three Jobs That Auxiliary Power Does
Auxiliary power pushes water, moves air, and rejects heat.
Pump power depends on flow rate, head, and pump efficiency, not simply on whether water is flowing. Breaking station service down by equipment shows where the savings are.
Fan load also includes the resistance of the air preheater. When you evaluate heat recovery in an air preheater, put the fuel savings and the extra fan power in the same balance to see the net effect.
The Station Service Ratio Is Based on Gross Generation
The station service ratio is station service energy divided by generating-end (gross) energy. With 30 generated and 3 used in the plant, the ratio is 10%. It is not 3% (3 divided by the fuel input of 100), and it is not 3 divided by the net 27.
This matches the definition from the Institute of Electrical Engineers of Japan (IEEJ), and India's CERC tariff regulations also express auxiliary energy consumption as a percentage of gross energy at the generator terminals. The US EIA defines net generation the same way: gross generation minus station service.
The scope of "station service" is not identical everywhere, though. The IEEJ definition excludes pumping power at pumped-storage plants, while the EIA counts it as station service. CERC includes transformer losses within the generating station and excludes power for the housing colony and construction work.
The ratio also changes with the type of plant, the auxiliary configuration, and the load. If generation halves while station service energy stays the same, the ratio doubles. Use measured values for the same plant and period, not a figure assumed from plant size or type.
Gross vs. Net Efficiency: A Worked Energy Balance
Take a fuel heat input of 100 as an illustration. Say boiler, piping, and other losses are 10 and the heat rejected from the condenser to the cooling system is 60. The remaining 30 becomes electricity, so the gross (generating-end) efficiency is 30%.
The figure splits this into two steps: the heat balance up to the generator, then what happens to the electricity.
Figure 3: Following 100 Units of Fuel Heat in Two Steps
Separate the heat balance up to the generating end from how the electricity is used.
Each bar is drawn at 100% width for its own total; the lower bar enlarges the 30 from the upper bar. The split does not represent typical losses in a real plant.
If auxiliaries use 3 of the 30 units, 27 can be sent out. The net (sending-end) efficiency is 27 divided by the fuel input of 100, or 27%. The generator's output itself does not change.
In this example, the heat leaving the condenser and the station service power are separate flows. The 60 units of heat carried off by cooling water are not equal to the 3 units of electricity used by the pumps and cooling tower fans. Count heat and electricity separately.
Cooling steam back to water is part of the Rankine cycle, and a heat balance diagram helps you track heat in and out of each component.
Plant Efficiency vs. Equipment Efficiency
The share of fuel heat a boiler passes to the steam is not the share of fuel heat the plant turns into electricity. Not all the heat in the steam becomes power, so using boiler efficiency as the gross plant efficiency gives the wrong answer.
Turbine work comes from the steam conditions at the inlet and outlet. Linking that calculation with boiler efficiency (fuel to steam) shows which stage's losses you are trying to reduce.
Cogeneration plants that also supply waste heat to production processes count useful heat as well. Electrical efficiency and total efficiency (power plus heat) answer different questions, so confirm which one a figure refers to.
Formulas: Gross Efficiency, Station Service Ratio, and Net Efficiency
Put fuel heat and electrical energy in the same unit before you divide. One kWh equals 3,600 kJ, so if electricity is recorded in kWh and heat input in kJ, multiply the kWh by 3,600.
Use a heating value that matches the unit of fuel consumption: kJ/kg for mass, kJ/m³ for gas volume. For gas, keep volumes at standard conditions separate from volumes at actual temperature and pressure.
For a 10% station service ratio, enter s as 10; dividing by 100 gives 0.10. If you use the decimal form, "net efficiency = gross efficiency × (1 − station service ratio)," enter 0.10 directly.
Worked Example: From Fuel Records to Net Efficiency
Assume that over one period the plant burns 10,000 kg of fuel with a heating value of 36,000 kJ/kg. Gross generation is 30,000 kWh and station service is 3,000 kWh. You can then calculate everything from the heat input onward.
The figure shows the three records you need, all covering the same period.
Figure 4: Align Both Meter Readings and the Fuel Record to One Period
With heat input, gross generation, and station service, you can cross-check both efficiencies.
Fictional calculation inputs. In kWh, the meter readings are 30,000 kWh and 3,000 kWh.
Both 30% and 27% come from fuel and electricity records for the same period. Mixing a daily generation figure with monthly fuel consumption makes the ratio meaningless, so match the start and end of every record first. It also helps to mark the metering points on a single-line diagram before you write the equations.
Power in kW is an instantaneous rate; energy in kWh is power accumulated over time. At constant output, multiply power by operating hours to get energy.
Converting Between Gross and Net
Divide net efficiency by (1 − station service ratio as a decimal) to get gross efficiency back. In the example, 27% ÷ 0.90 = 30%, which corresponds to the energy before the plant's own use.
From Efficiency to Heat Rate: kJ/kWh, Btu/kWh, kcal/kWh
Heat rate is the inverse of efficiency: the heat input needed to produce one kWh. Japanese documents usually state efficiency in percent, while US and Indian contracts often state heat rate. Convert with the energy content of one kWh.
- kJ/kWh: heat rate = 3,600 ÷ efficiency (as a decimal)
- Btu/kWh: heat rate = 3,412 ÷ efficiency, the factor the US EIA uses
- kcal/kWh: heat rate = 860 ÷ efficiency, useful for older Japanese texts and for kcal-based figures such as India's heat rate norms
Applied to the worked example, the conversions look like this. Because heat rate is the inverse of efficiency, net heat rate is gross heat rate divided by the share sent out, not multiplied by it.
| Basis | Efficiency | Heat rate (kJ/kWh) | Heat rate (Btu/kWh) | Heat rate (kcal/kWh) |
|---|---|---|---|---|
| Gross (generating end) | 30% | 12,000 | about 11,370 | about 2,870 |
| Net (sending end) | 27% | about 13,330 | about 12,640 | about 3,190 |
Labels vary by market. The US EIA reports heat rates per net kWh, while India's CERC regulations define "gross station heat rate" in kcal per kWh at the generator terminals and set auxiliary energy consumption as a separate norm.
A Japanese 発電端 value lines up with a gross figure, and a 送電端 value with a net figure. The boundary still needs checking, as the checklist below explains.
HHV vs. LHV: Check the Basis Before You Compare
Fuel has a higher heating value (HHV, also called gross calorific value or GCV) and a lower heating value (LHV, or net calorific value, NCV). HHV includes the heat released when water vapor from combustion condenses; LHV does not. For the same amount of fuel, the HHV heat input is larger.
Dividing the same output by a larger heat input means an HHV-based efficiency is lower than an LHV-based one. The gap depends on the fuel: LHV is roughly 4% below HHV for coal and about 10% below for natural gas. A plant at 40% on an HHV basis would be quoted at about 42% LHV on coal and about 44% LHV on natural gas.
Conventions differ by country and by equipment:
- Japan: Japanese power engineering references generally use HHV for plant thermal efficiency, and government efficiency benchmarks for thermal power are set on a generating-end, HHV basis. Equipment catalogs may still quote LHV, so check the footnote.
- United States: HHV is the usual basis for coal-fired plants, while efficiencies for natural gas-fired plants are commonly quoted on an LHV basis.
- Parts of Europe and elsewhere: LHV is common for reporting thermal efficiency, but confirm the basis on each document.
- India: CERC tariff norms work with gross calorific value (GCV) and gross station heat rate in kcal/kWh.
Gross vs. net (where the output is measured) and HHV vs. LHV (what goes in the denominator) are two separate questions. Check both before comparing a Japanese figure with your own.
Performance tables also state the load and ambient conditions. A rated-load guarantee and an annual operating average are affected differently by starts, stops, and low-load operation, so match the operating conditions too, even when the efficiency carries the same name.
Receiving End: Losses Beyond the Plant
The receiving end, 受電端 (judentan), is where a customer receives the electricity. Transmission lines and transformers lose energy between the sending end and that point (transmission and distribution, or T&D, losses), so efficiency measured to the customer is lower than net plant efficiency.
Between a power plant and a factory, the electricity is stepped up, transmitted, transformed, and distributed. If the receiving end is the factory's incoming metering point, losses in the plant's internal wiring and production equipment belong to the factory's own energy balance.
For illustration, assume a net efficiency of 27% and a total loss of 5% to the receiving end. Then 27 × 0.95 gives a receiving-end efficiency of 25.65%. The 5% is a calculation assumption, not an actual grid figure.
Some documents list the transmission and distribution loss rate and the substation's own consumption separately. In that case, multiply by each remaining fraction. If one total loss rate already includes substation consumption, applying the substation rate again subtracts the same loss twice.
A Historical Japanese Example: Receiving-End Efficiency and Primary Energy
A Q&A from J-Net21, run by Japan's Organization for Small & Medium Enterprises and Regional Innovation (SMRJ), gives a daytime example based on FY2003 data. It uses gross efficiency of 40.44%, a station service ratio of 4.6%, a T&D loss rate of 6.3%, and substation consumption of 0.13%.
Using the same source's total loss rate of 10.7% gives about 36.11%, slightly different from 36.10% from the individual rates. Both round to 36.1%, and dividing 3,600 by 0.361 gives about 9,972 kJ/kWh.
This shows how efficiency relates to primary energy. It is not the factor to use in current reporting under Japan's Energy Conservation Act; check the official forms for the relevant fiscal year.
How Cutting Auxiliary Power Raises Net Efficiency
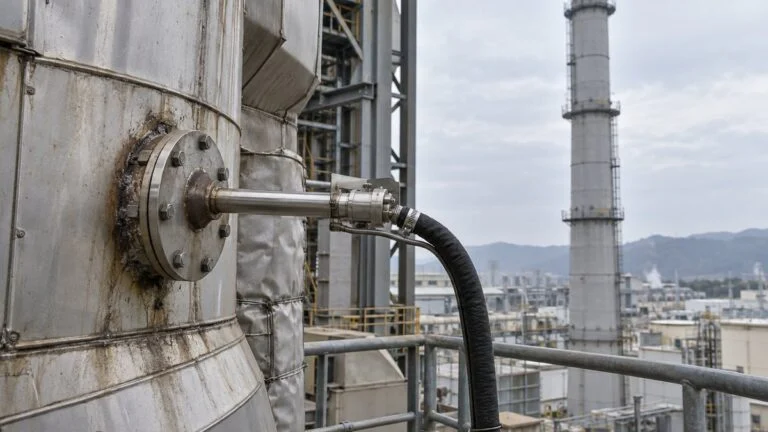
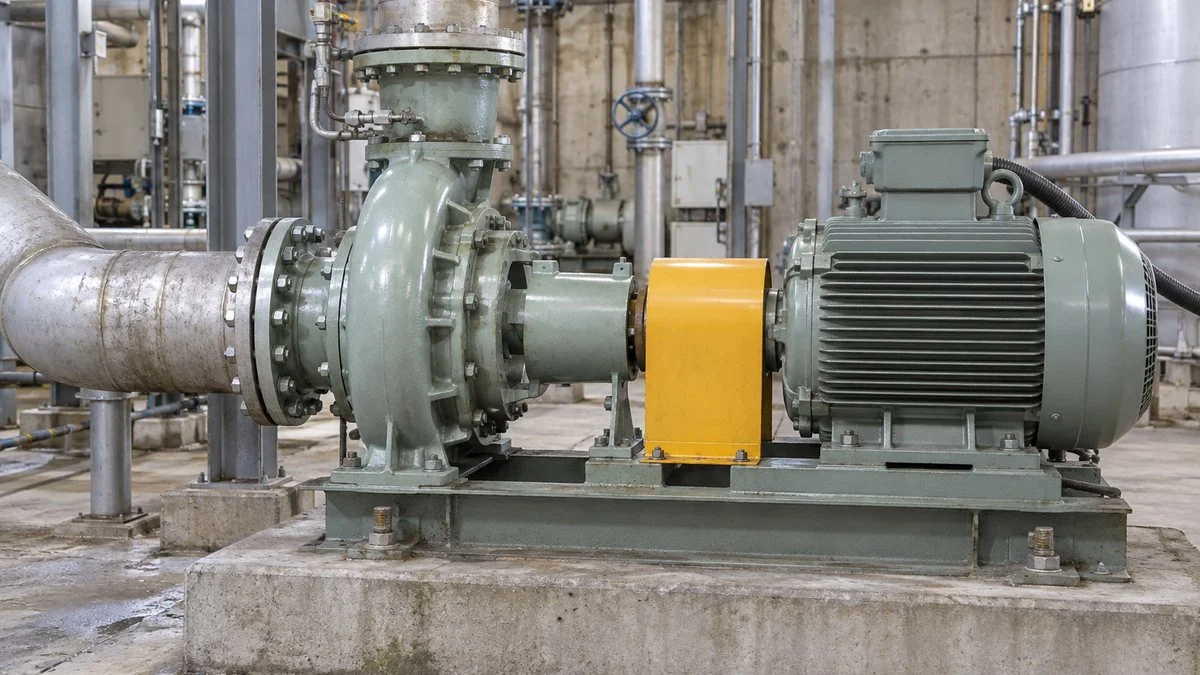
Motor-driven pumps like the one below are typical station service loads.
Even with the same gross efficiency, net efficiency rises when auxiliaries use less power. The figure holds gross efficiency at 40% and changes only the station service ratio.
Figure 5: Station Service Ratio vs. Net Efficiency at 40% Gross
A drop in the station service ratio raises net efficiency by that drop times the gross efficiency.
Hypothetical comparison. Going from 10% to 8% cuts the ratio by 2 points and raises net efficiency by 0.8 points.
For example, hold gross generation at 100,000 kWh and lower the station service ratio from 10% to 8%. Station service drops by 2,000 kWh, and that energy can be sent out instead. Fuel input and gross efficiency stay the same.
If net output is held constant instead, the plant needs less gross generation. Gross efficiency also changes with load, though, so work out actual fuel savings from generation and fuel records before and after the change.
When you compare before and after, check the energy used by each auxiliary against operating records. Putting load and operating hours next to generation helps separate changes caused by operating conditions from the effect of the improvement itself.
Auxiliary improvements keep the required water and air flow while cutting excess power. Look at pump efficiency together with operating conditions, and judge the result at the plant's sending end rather than at the single machine.
The table sums up the three efficiencies by measurement point and by what each one subtracts.
| Item | Gross (generating end) | Net (sending end) | Receiving end |
|---|---|---|---|
| Measurement point | Generator terminals | Where power leaves the plant after station service | Where the customer receives power |
| Electricity in the numerator | Gross energy | Gross energy minus station service energy | Net energy minus T&D losses |
| What is subtracted | Nothing | Station service: feedwater pumps, draft fans, and so on | Also transmission line and transformer losses |
| Worked example | 30% | 27% (10% station service) | 25.65% (5% total loss) |
| Relative size | Highest of the three | Lower than gross | Lower than net |
Checklist: Reading Gross and Net Figures in a Japanese Spec
Before you compare a Japanese efficiency or heat rate with your own numbers, confirm each item below. Two figures can disagree simply because one of these differs.
- Boundary: Is the value 発電端 (gross, generator terminals) or 送電端 (net, sending end)?
- Heating-value basis: Is the heat input on an HHV or LHV basis? Look for 高位 (HHV) or 低位 (LHV) in the notes.
- Station service scope: Which loads are included? Fuel handling, cooling towers, environmental equipment, buildings, and HVAC may or may not be counted.
- Transformer losses: Are the generator step-up transformer and unit auxiliary transformer losses part of station service, or are they outside the boundary?
- Metering points: Where exactly are gross output, station service, and net output metered, and which meter classes are used?
- Denominator of the ratio: Is 所内率 divided by gross generation, as in the usual definition?
- Period and type of value: Is it a rated-load design value, a test result, or an annual operating average?
- Conditions: What load, ambient temperature, cooling water temperature, and fuel are assumed?
- Units: Is heat rate in kJ/kWh, kcal/kWh, or Btu/kWh? Is efficiency in percent or as a decimal?
- Cogeneration: Does a figure mean electrical efficiency only or total efficiency including useful heat?
Questions to Ask the Japanese Supplier
If the specification does not answer the checklist, send questions like these. They work for a boiler, turbine, cogeneration, or complete power plant package.
- Is the guaranteed efficiency (or heat rate) at the generating end (発電端) or at the sending end (送電端)?
- Is the fuel heat input based on HHV (高位発熱量) or LHV (低位発熱量)? Which fuel analysis and heating value were used?
- Please list the loads included in station service (所内電力). Are fuel handling, cooling tower fans, flue gas treatment, and building loads included?
- Are transformer losses (generator step-up and unit auxiliary transformers) included in station service or excluded from the boundary?
- Where are gross output, station service, and net output metered? Please mark the metering points on the single-line diagram.
- Is the station service ratio (所内率) calculated against gross generation?
- What load, ambient conditions, and cooling water temperature apply to the guaranteed value? Is there a correction curve for other conditions?
- Which test code or procedure will be used to verify the guarantee, and is it agreed with us?
A short inquiry you can adapt:
Subject: Clarification of efficiency basis in performance data
We are reviewing the performance data sheet for [equipment]. Please confirm: (1) whether the stated efficiency and heat rate are at the generating end (gross) or sending end (net); (2) whether the heat input is on an HHV or LHV basis; (3) which loads and transformer losses are included in station service; and (4) the metering points for gross output, station service, and net output. A marked-up single-line diagram would help us align your values with our contract terms.
For acceptance testing, agree on the test code and boundary before the test, not after. ASME PTC 46 (Overall Plant Performance) is one code used for whole-plant tests that report corrected net power and heat rate.
Whether it applies to your project is a contract decision.
Limits of This Guide
- The numbers in the worked examples and Figure 5 are fictional and do not represent typical plant performance.
- Station service definitions differ by organization, regulator, and contract. Pumped-storage pumping, transformer losses, and site facilities are treated differently.
- HHV/LHV conventions are general practice, not rules. Always check the basis stated on the specific document.
- The FY2003 Japanese example is historical. It is not a current factor for any regulatory reporting.
- Performance guarantees and test methods depend on the contract. This guide describes what to check, not how a test must be run.
FAQ
Which Is Higher, Gross or Net Efficiency?
Gross efficiency, as long as both use the same heat input and period and the plant consumes some of its own power. Part of the generated energy goes to station service, so the more the plant uses, the wider the gap between the two.
Does a 10% Station Service Ratio Mean Subtracting 10 Points?
No. The ratio is a share of gross generation, so multiply gross efficiency by 0.90. At 40% gross, net efficiency is 36%, 4 points lower, not the 30% you would get by subtracting 10 points.
Can You Calculate the Station Service Ratio from Power (kW) Instead of Energy (kWh)?
Yes, for a single moment, if both readings are taken at the same time. For a period, use integrated energy (kWh). When load varies, a simple average of instantaneous ratios can differ from the energy-based ratio.
Is Receiving-End Efficiency the Same as Net Plant Efficiency?
No. Transmission and distribution losses lie between the plant's sending end and the customer's receiving end. Which receiving point is meant changes the scope, so when you evaluate purchased power for a factory, draw the balance up to the incoming metering point.
Does High Net Efficiency Mean the Generator Itself Is Efficient?
Not necessarily. Net efficiency reflects both heat-to-power conversion and station service. To find the cause of a change, separate gross efficiency from the station service ratio, and evaluate the generator alone from its shaft input and electrical output.
Sources
- Definition of station service power and station service ratio: IEEJ, Electrical Terminology "Station service power" (Japanese)
- Generating-end and sending-end thermal efficiency, HHV as the usual basis: Power Academy, Electrical Engineering Glossary "Thermal efficiency" (Japanese)
- Japanese government thermal power efficiency benchmarks on a generating-end, HHV basis: METI, Working Group on Thermal Power Generation material (Japanese)
- Path of electricity from power plant to customer: Federation of Electric Power Companies of Japan, "How electricity is delivered" (Japanese)
- FY2003 receiving-end efficiency example: SMRJ J-Net21, "How is the primary energy factor for electricity under the Energy Conservation Act derived?" (Japanese)
- HHV and LHV definitions: Mitsubishi Heavy Industries news release on triple combined cycle research (Japanese)
- HHV/LHV gap by fuel and regional conventions: National Research Council, Coal: Energy for the Future (1995)
- Net generation and station service, including pumped storage: US EIA Glossary, "Net generation"
- Heat rate, 3,412 Btu/kWh, and Btu per net kWh: US EIA FAQ, "What is the efficiency of different types of power plants?"
- Auxiliary energy consumption, gross station heat rate, and GCV definitions: CERC (Terms and Conditions of Tariff) Regulations, 2024
- ASME PTC 46 scope and test boundary: ANSI Webstore, ASME PTC 46-2015 (R2025)
- Feedwater and circulating water pumps in thermal plants: Mitsubishi Heavy Industries, pumps for thermal power plants (Japanese)
- Flow, head, air volume, pressure, and motor power: Japan Electrical Engineers' Association, calculating required motor output (Japanese)
Original article in JapaneseThis guide is adapted from a MONOSCOPE article written for readers in Japan: 発電端効率と送電端効率の違い|所内率の計算式と受電端まで
About the editor
 MONOSCOPE EditorFOUNDER & EDITOR
Spent about ten years at a plant equipment maker and a plant engineering company, proposing, designing, and commissioning equipment, then moved into web marketing. Now a web consultant for B2B manufacturers, helping them explain their products and technology. Licensed in Japan as an Energy Manager and a Third-Class Chief Electrical Engineer.
Has run an engineering blog since 2017 (500+ articles) and a Japanese YouTube channel with about 20,000 subscribers. Each English guide is written from the Japanese shop-floor point of view and checked against the cited standards.