How Inverters (VFDs) Save Energy: Fan and Pump Speed
Someone at your site wants to put a variable frequency drive (VFD) on a fan or pump, and the proposal says power will drop by half. A Japanese document calls the same device an "inverter" and backs its savings figure with a yen rate and a 50 Hz or 60 Hz assumption. Before you put any of those numbers in an approval request, you need to know when they hold.
The short answer: in theory, running a fan at 80% speed cuts shaft power to 51.2% of the rated value, because power follows the cube of speed. That figure assumes all the system resistance is friction. Static head and constant-torque loads shrink the savings, and a machine that always runs at rated speed can end up using more power.
This guide explains the two names for the device, the affinity laws, how a VFD compares with a damper or throttling valve, and where static head breaks the cube law. It then gives three ways to calculate savings, plus a checklist and a list of questions for the Japanese side.
Contents
- Inverter or VFD: One Device, Two Names
- Affinity Laws: Why Power Falls With the Cube of Speed
- VFD vs. Damper or Throttling Valve
- Static Head: Where the Cube Law Breaks Down
- Where VFDs Pay Off and Where They Don't
- VFD Energy Savings Calculation: Three Methods
- Reading Japanese Numbers and Specs
- What to Check Before Installation
- Checklist: Before You Submit the Number
- Questions for the Japanese Supplier
- Limits of This Guide
- FAQ
- Sources
Inverter or VFD: One Device, Two Names
Japanese drawings, catalogs, and public energy-saving guides usually call this device an inverter (インバータ, inbata). In the US and India, you will more often see VFD, variable speed drive (VSD), or AC drive. Strictly speaking, a VFD is the most common type of VSD.
This guide uses "VFD" from here on. When a Japanese document says "inverter" in the context of a motor, it means the same thing.
Why a drive is needed at all comes down to one formula. Synchronous speed in rpm is 120 × frequency ÷ number of poles, so a 4-pole motor runs near 1,500 rpm on 50 Hz and near 1,800 rpm on 60 Hz. On fixed-frequency line power, an induction motor runs at essentially one speed.
A VFD removes that limit by rebuilding the power it feeds to the motor, as Figure 1 shows.
The drive converts line power to DC, then builds AC at the required frequency and sends it to the motor.
Inside the drive, AC is rectified to DC and smoothed by a capacitor. Semiconductor switches then create AC at a new frequency and voltage. Based on a Japan Electrical Manufacturers' Association document.
As frequency drops, the drive lowers voltage in proportion. This constant V/f control keeps the magnetic flux in the motor steady while the speed changes. This guide covers the most common pairing in factories: a three-phase induction motor and a VFD.
Affinity Laws: Why Power Falls With the Cube of Speed
The affinity laws (相似則, sojisoku, in Japanese documents) describe how a fan or centrifugal pump responds to a speed change. Flow varies with speed, pressure with the square of speed, and shaft power with the cube of speed. Power is proportional to flow times pressure, so the first and second powers multiply into a third power.
Written out, a speed change from N1 to N2 gives these results:
- Flow: Q2 = Q1 × (N2/N1)
- Pressure: P2 = P1 × (N2/N1)²
- Shaft power: L2 = L1 × (N2/N1)³
Figure 2 plots the three curves. Japan's Ministry of the Environment (MOE) uses the same 80% example in its fact sheet, and the US Department of Energy (DOE) puts it as a 20% speed cut reducing input power by about 50%.
At 80% speed, flow is 80%, pressure is 64%, and shaft power is 51.2% of the rated value.
These laws assume the same impeller, constant fluid density, about the same efficiency at each operating point, and resistance from pipe or duct friction only (zero resistance at zero flow). If a fixed lift or back pressure is present, pressure cannot fall as far and power falls more slowly than the cube.
Figure 2 shows ideal curves. A real power meter also reads motor and drive losses, and efficiency falls at low speed, so measured power comes in somewhat above the calculation. The DOE notes that VFD efficiency drops as load falls, especially in small drives.
Those losses matter less than they first seem. In a DOE example, a 20 hp (about 15 kW) exhaust fan at half speed, with motor efficiency of 77.8% and drive efficiency of 86%, still draws only 2.8 kW instead of 16.4 kW.
Variable-Torque and Constant-Torque Loads
Fans, pumps, and blowers are variable-torque loads: torque falls with the square of speed, so power falls with the cube. Japanese documents call this nijo teigen toruku (2乗低減トルク).
Constant-torque loads behave differently. Torque stays about the same at any speed, so power falls only in proportion to speed. Conveyors, extruders, mixers, positive displacement pumps, and screw air compressors belong in this group, and the cube law does not apply to them.
VFD vs. Damper or Throttling Valve
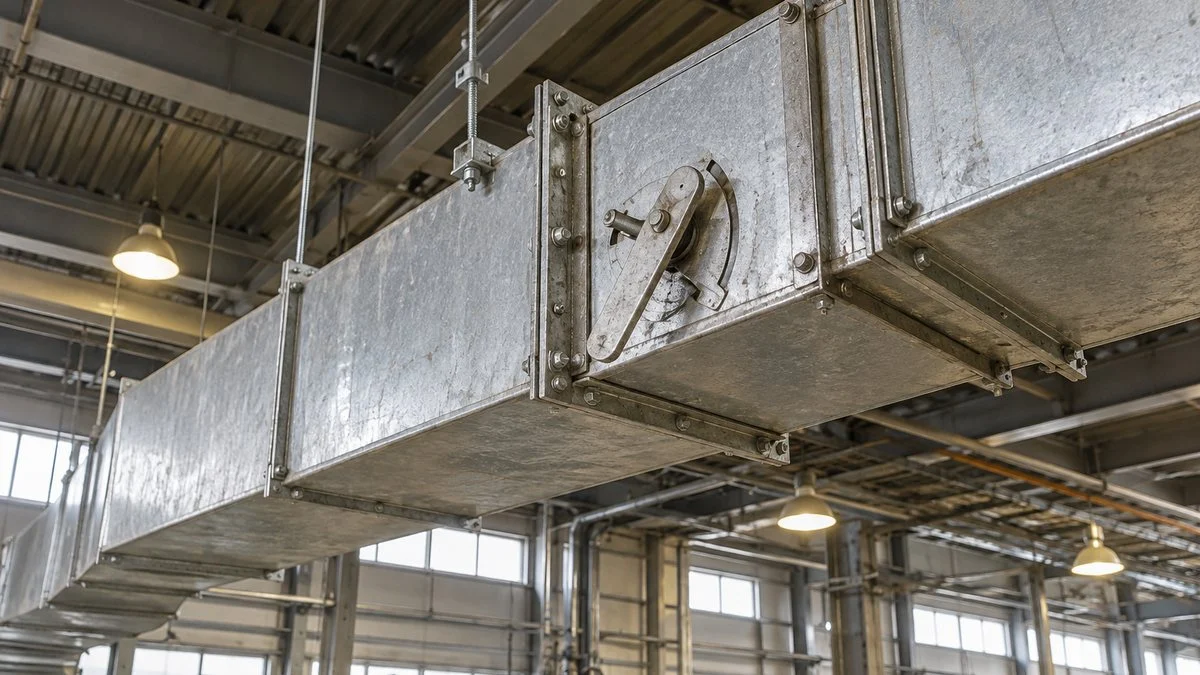
Without a VFD, flow is usually reduced by closing an outlet damper on a fan or a discharge valve on a pump. The motor keeps running at close to full speed while added resistance cuts the flow. The energy lost across the valve is still part of the power you pay for.
A VFD lowers the pump or fan curve itself, so no resistance needs to be added. The DOE guide states that speed control is always more efficient than a control valve for flow control. Figure 3 shows how large the gap can be for one centrifugal fan.
At the same 80% airflow, shaft power is 95% with a damper and 51% with reduced speed.
Values are for a centrifugal fan, as assumed in the MOE fact sheet from a chart in an Energy Conservation Center, Japan (ECCJ) data sheet.
Damper control saves a little because the shaft power of a centrifugal fan falls somewhat with flow. The same data sheet also has curves for inlet dampers, inlet vanes, and fluid couplings. The existing control method changes the savings, so identify it first.
This table sums up the differences.
| Point of comparison | Damper or valve control | VFD control |
|---|---|---|
| How flow is reduced | Added resistance | Lower speed |
| Motor speed | Close to full speed | Falls to match the required flow |
| Pressure | Rises as you throttle | Falls with the square of speed |
| Shaft power at 80% airflow (centrifugal fan example) | About 95% | About 51% |
| Equipment cost | Low: damper or valve only | Drive and installation work needed |
The Same Comparison on a Pump Curve
A pump runs where its performance curve crosses the system curve. Closing a valve steepens the system curve, so the operating point moves up and to the left: flow falls, but head rises. Lowering the speed drops the pump curve instead, so the same flow is delivered at a much lower head.
Figure 4 uses a worked example from J-Net21, a Japanese government-backed support site for small and midsize companies. Its pump has a shutoff head of 1.4 times rated head and a static head of 0.3 times rated head, and it is cut to half of rated flow.
At half flow, valve control operates at a head of 1.3 and VFD control at a head of 0.475 (rated head = 1.0).
Schematic drawn with the same conditions as the J-Net21 example: shutoff head 1.4 times rated head, static head 0.3 times rated head, flow cut to half of rated.
In this example, valve control needs 65% of rated power and speed control needs 24%, which J-Net21 reports as a 63% saving. That 63% is measured against the throttled case, not against rated power. When you read a Japanese savings percentage, always check the baseline.
Static Head: Where the Cube Law Breaks Down
Total head has two parts. Static head (実揚程, jitsu-yotei) is the height the liquid must be lifted, or a fixed back pressure at the destination, and friction head varies with the square of flow. A closed-loop circulating system has only friction head, and friction-only resistance is the condition the cube law assumes.
Static head stays the same however far you reduce the flow, so that part of the head cannot be reduced. Fans face the same limit when the duct end must hold a fixed static pressure.
The DOE guide calls the use of the affinity laws for savings in systems with static head a common mistake that can cause major errors. Figure 5 shows the size of the gap at half flow.
At 50% flow, required power is 12.5% under the ideal cube law, about 24% with static head at 30% of rated head, and 65% with valve control.
Schematic using the J-Net21 example conditions (shutoff head 1.4, static head 0.3), with pump efficiency held constant. In practice efficiency falls at low flow, so power is higher than shown.
Speed control still beats the valve, but the curve is far from the cube line. J-Net21 says speed control works best when static head is small and the flow ratio is about 30–80%. In its example, the largest saving comes near 60% flow.
Speed Floor: The Pump Must Still Beat the Static Head
Shutoff head falls with the square of speed. Once it falls below static head, the pump can no longer deliver flow, and without a check valve the liquid can run backward. A first estimate of this floor is the square root of static head divided by shutoff head.
With the 1.4 shutoff head above, the floor is about 46% speed for a static head of 0.3, and about 65% for a static head of 0.6. These are our calculations, and the real minimum sits higher. Your pump supplier should set it from the reduced-speed curves and the minimum continuous flow.
Flow also falls faster than speed once static head is present. In the same model, half flow takes about 64% speed at a static head of 0.3 and about 76% at 0.6. So do not assume the flow ratio equals the speed ratio in these systems.
For water supply that needs a large total head, Japan's MOE recommends controlling flow by pump staging (台数制御, daisu seigyo) rather than speed, because head can run short at reduced speed. Combining staging for coarse control with a VFD for fine trim is also worth evaluating.
Where VFDs Pay Off and Where They Don't
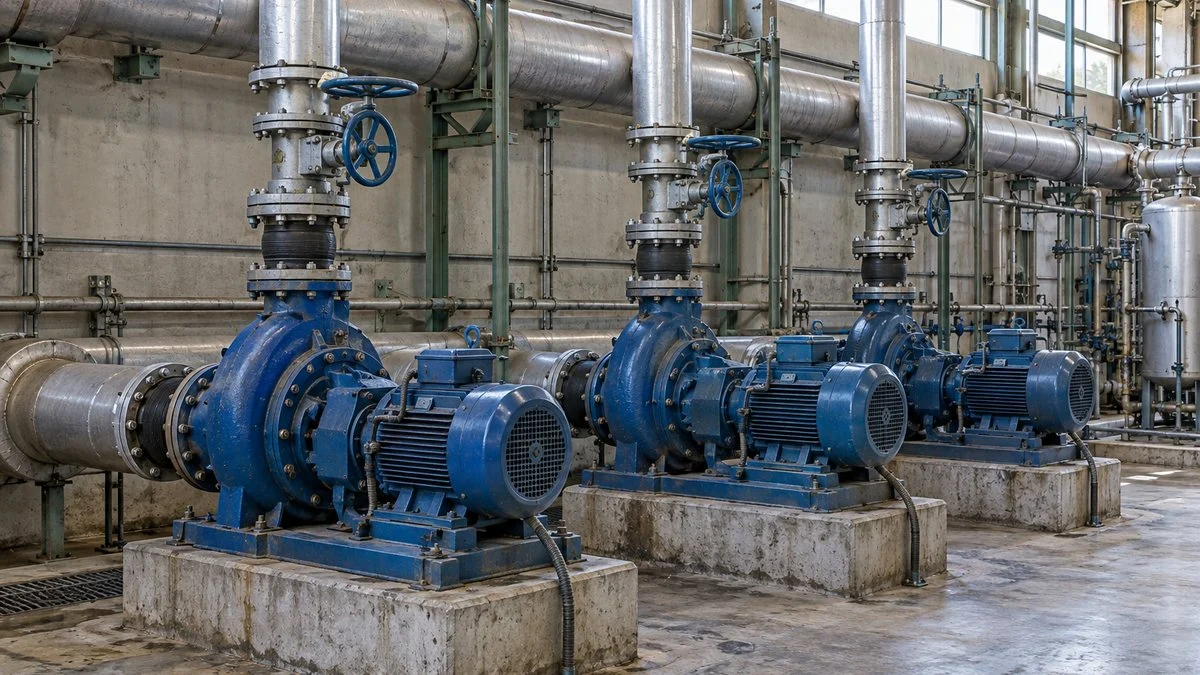
Three things largely decide the result: the load type, how much the flow varies, and what makes up the resistance. The best candidates are variable-torque machines that run throttled for long hours against mostly friction losses. Figure 6 sorts common equipment.
Even among fans and pumps, the result depends on how the machine runs and what makes up the resistance.
Larger savings
Smaller savings
Machines that stay near rated flow have no room to slow down, and the drive's own conversion losses add to the bill. For this reason, Japan's MOE suggests switching to line power (shoyo dengen, 商用電源) when a pump runs at rated flow. This arrangement is commonly called a VFD bypass, and a qualified electrical engineer should design it.
VFD Energy Savings Calculation: Three Methods
Start from what the machine uses today, not from its nameplate. Motors often run below rated load, so using rated kW as actual consumption overstates the savings. J-Net21 applies a 90% load factor (fukaritsu, 負荷率) for this reason, and a power meter reading is better still.
Figure 7 shows the overall sequence. The right formula for step 3 depends on how the machine is controlled now and on its static head.
Turn logged site data into kWh with the right speed or power ratio and efficiency, then apply your rate.
With static head or a fixed back pressure, savings are smaller than the cube law predicts.
Method A: Valve Fully Open, Friction Only
Use this method when the valve or damper is already fully open, static head is close to zero, and you simply want less flow.
New kWh = current kWh × (speed ratio)³ ÷ drive efficiency
J-Net21 works through a 37 kW (about 50 hp) cooling water pump with 92.5% efficiency (read here as motor efficiency) and a 90% load factor, running 24 hours a day for 310 days a year. Current use is about 267,800 kWh. At 85% speed and 95% drive efficiency, that becomes 267,800 × 0.85³ ÷ 0.95, or about 173,100 kWh.
The saving is about 94,700 kWh a year, or about 35%. At JPY 22.0/kWh, J-Net21 puts it at about JPY 2.08 million. The example assumes 0 m of static head, so treat it as a best case.
Method B: Currently Throttled With a Damper or Valve
Today's reading already includes throttling losses, so do not simply multiply it by the cube of speed. Use the ratio between the two control methods at the same flow, taken from a fan curve or data sheet.
New kWh = current kWh × (VFD shaft power ratio ÷ throttled shaft power ratio) ÷ drive efficiency
Japan's MOE models a 22 kW (about 30 hp) exhaust fan at 80% airflow, running 6,480 hours a year with 95% motor efficiency and 90% drive efficiency. It calculates current use as 142,600 kWh. With shaft power ratios of 51% and 95%, the result is 142,600 × (51 ÷ 95) ÷ 0.90, or about 85,000 kWh.
The saving is about 57,600 kWh a year, or about 40%. The 95% and 51% values come from one chart for a damper on a centrifugal fan. Other control types have their own curves.
Method C: System With Static Head
When static head is present, estimate the power from flow and head rather than from speed. With hs as the static share of rated head and Q as the flow ratio, the head on the system curve is hs + (1 − hs) × Q².
Power ratio ≈ Q × (hs + (1 − hs) × Q²), then divide by drive efficiency.
The table applies that formula. At 50% flow, the valve and hs = 0.3 values match the J-Net21 example, which rounds 23.8% to 24%. The other values are our calculations using the same model.
| Flow | Valve control | VFD, hs = 0 (cube law) | VFD, hs = 0.3 | VFD, hs = 0.6 |
|---|---|---|---|---|
| 90% | 96.8% | 72.9% | 78.0% | 83.2% |
| 80% | 91.5% | 51.2% | 59.8% | 68.5% |
| 70% | 84.3% | 34.3% | 45.0% | 55.7% |
| 60% | 75.4% | 21.6% | 33.1% | 44.6% |
| 50% | 65.0% | 12.5% | 23.8% | 35.0% |
Treat the VFD columns as optimistic. The DOE guide warns that in high-static-head systems, a small speed cut greatly reduces both flow and pump efficiency. For a number you will defend in an approval request, ask the supplier for pump curves at reduced speed, with efficiency shown.
Convert kWh to Your Own Currency
Keep kWh as the main result, because the yen figures in Japanese examples do not carry over. The MOE fan example uses JPY 22.76/kWh.
The table below applies other rates to the same 57,600 kWh. These rates are placeholders, not market prices, so replace them with the rate from your own bill.
| Rate per kWh | Annual saving on 57,600 kWh |
|---|---|
| JPY 22.76 (MOE example) | About JPY 1.31 million |
| USD 0.10 (placeholder) | USD 5,760 |
| INR 8 (placeholder) | INR 460,800 |
| Your rate: ____ | 57,600 × your rate |
Ask your finance team which rate the approval should use. J-Net21 uses a blended rate that includes the base charge, but fixed charges may not fall in step with kWh.
For simple payback, divide the installed cost by the annual saving. Include the drive, installation, any reactors or filters, and any motor change, and get those costs from a quote.
After installation, compare metered kWh under the same conditions. The gap between the estimate and the measurement will improve your next estimate.
Reading Japanese Numbers and Specs
Japan runs on two frequencies: 50 Hz in the east, including Tokyo, and 60 Hz in the west, including Osaka. Equipment built in Japan can therefore be rated for either one, and its home frequency may not match your plant.
The cube law makes this a real issue. A centrifugal machine rated at 50 Hz and run at 60 Hz turns 20% faster and needs about 73% more shaft power (1.2³ = 1.73). A 60 Hz machine run at 50 Hz turns about 17% slower, with about 58% of the power and about 69% of the pressure.
Confirm the rated frequency before you compare any figures. These ratios are our arithmetic from the affinity laws. Ask the supplier whether the machine and motor can run at your frequency at all.
Use this table as a starting point for the country differences.
| Location | Mains frequency | Harmonics reference to start from |
|---|---|---|
| Japan | 50 Hz (east), 60 Hz (west) | 1994 guideline for high-voltage consumers, with technical guideline JEAG 9702 |
| US | 60 Hz | IEEE 519-2022; confirm the utility's requirement |
| India | 50 Hz | Confirm with your utility |
| Thailand, Vietnam, Indonesia, Malaysia | 50 Hz | Confirm with your utility |
| Philippines | 60 Hz | Confirm with your utility |
These terms appear often in Japanese energy-saving documents and specifications.
| Japanese | Romaji | English |
|---|---|---|
| 省エネ | sho-ene | Energy saving |
| 軸動力 | jiku-doryoku | Shaft power |
| 回転数制御 | kaitensu seigyo | Speed control |
| 実揚程 / 全揚程 | jitsu-yotei / zen-yotei | Static head / total head |
| 風量 | furyo | Airflow |
| 商用電源 | shoyo dengen | Line (utility) power |
| 高調波 | kochoha | Harmonics |
Top Runner Motors and Frequency Settings
Since April 2015, Japan has required most industrial three-phase induction motors to meet its Top Runner standard, which the International Energy Agency describes as IE3 level. NEMA Premium is commonly treated as comparable to IE3 in the US, but confirm efficiency on the data sheet rather than treating the labels as identical.
The Semiconductor Equipment Association of Japan notes that these motors have less slip and turn slightly faster. It recommends checking or changing the settings of any VFD used with them. Since power rises with the cube of speed, ask the supplier or a qualified engineer to review the frequency setting whenever a motor is replaced and a VFD is added together.
What to Check Before Installation
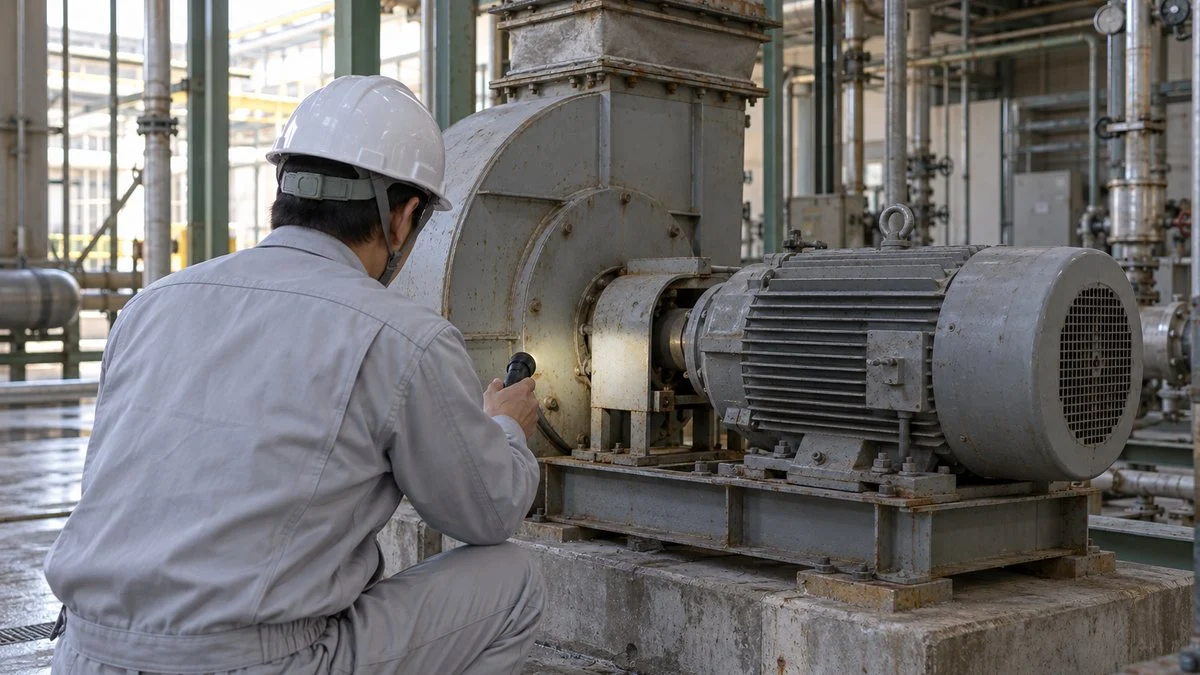
A VFD does not automatically pay for itself. On the wrong machine, it can cause low flow, an overheated motor, or vibration. Work through the checks in order: operating data, process limits, motor and mechanical limits, and then the electrical system.
Operating Data and Process Limits
Log damper or valve position, flow and pressure variation, and run hours for one week to one month. A machine that stays near fully open offers little saving. The DOE guide suggests a duration diagram, which shows the hours per year spent at each flow rate, so that you can calculate each operating condition and add them up.
Then confirm the minimum flow and pressure the process needs. Pressure falls with the square of speed: MOE points out that 90% flow means 19% less discharge pressure. The pressure required at the far end of the line sets a limit on how low the speed can go.
Minimum Speed, Cooling, and Vibration
Most induction motors cool themselves with a shaft-mounted fan, so long runs at low speed reduce the cooling air. Ask the manufacturer for the allowed continuous speed range and whether a separately driven cooling fan is needed.
Variable speed also raises the chance of hitting a structural resonance within the operating range. Many drives can skip a frequency band, so check vibration and noise during commissioning.
Fans have a further risk of unstable operation, such as surging, in some speed ranges.
Motor Insulation and Drive Location
According to the DOE guide, VFDs fit most existing motors on 400 V networks. That is generally not the case in the US and other areas above 440 V, where reinforced-insulation "inverter duty" motors are often needed. Long cables can raise the voltage at the motor terminals, and larger motors can suffer bearing damage from shaft voltage.
Two standards are useful to name when you ask about this: NEMA MG 1 Part 31 for inverter-rated motors, and IEC TS 60034-25:2022 as guidance for converter-fed machines. Also check the drive's location. Electronics tolerate corrosive and damp areas poorly, and the DOE guide says operating a VFD in a potentially explosive atmosphere is not usually possible.
Harmonics and the Power System
Charging the drive's smoothing capacitor distorts the input current, which creates harmonics at whole-number multiples of the mains frequency. In the US, IEEE 519-2022 is a common reference. It applies its limits at the point of common coupling, the interface between utility and customer, not at each drive.
A published summary of the 2022 edition gives voltage total harmonic distortion limits of 8% at 1 kV and below, and 5% above 1 kV up to 69 kV. Current limits depend on the ratio of short-circuit current to load current. Confirm these values against the standard itself.
In Japan, the 1994 guideline for consumers receiving high or special high voltage applies, along with JEAG 9702, and Japanese drive catalogs list a conversion factor for the calculation. Measures include AC or DC reactors and pulse-width-modulated converters.
Have your electrical engineer and utility review these points, because harmonics also affect power-factor correction capacitors.
Checklist: Before You Submit the Number
Use this list to review a VFD proposal, whether it is yours or a vendor's.
- Load type: variable-torque fan or centrifugal pump, not a constant-torque machine
- Current control: outlet damper, inlet damper, vanes, valve, or fully open
- Baseline: measured kW or kWh, not nameplate kW
- Flow profile: hours per year at each flow, from logged data
- Static head: share of rated head, and the calculation method that matches it (A, B, or C)
- Process limits: minimum flow, minimum pressure, and required head at the far end
- Efficiency: drive and motor efficiency at the actual part load, not only at full load
- Rated frequency: 50 Hz or 60 Hz for the machine, the motor, and your plant
- Motor: rated for VFD use, cooling at low speed, and bearing protection on larger motors
- Electrical: harmonics review, capacitors, cable length, and drive location
- Money: your own rate per kWh, full installed cost, and simple payback
- Verification: a plan to compare metered kWh before and after
Questions for the Japanese Supplier
If the equipment or the savings figure comes from Japan, send these questions early. They are written so you can paste them into an email.
- What is the rated frequency of the machine and the motor? Please send performance curves for 50 Hz and 60 Hz.
- Please send performance curves at reduced speed, with efficiency and minimum continuous flow shown.
- What is the allowable continuous speed range? Is separate motor cooling needed at low speed?
- Is the motor rated for VFD use? To which standard (for example, NEMA MG 1 Part 31 or IEC TS 60034-25)?
- What is the drive efficiency at part load? Does the drive have a built-in AC or DC reactor? What harmonic data can you provide?
- Which speed ranges should we avoid because of resonance or unstable operation?
- Your energy-saving figure: what are the baseline control method, static head, drive efficiency, run hours, and electricity rate?
- Does a VFD retrofit affect the warranty on this machine?
Limits of This Guide
- The worked examples come from Japanese public guides and use assumed values. They are not measured results or guarantees.
- Method C assumes constant pump efficiency. Real savings are lower when efficiency falls at low flow.
- The minimum speed calculations are first estimates. The supplier's curves take priority.
- Positive displacement pumps, compressors, and other constant-torque machines need a different analysis.
- Harmonics limits and motor standards are summarized from secondary sources. Confirm them against the current standards and your utility's rules.
- Electricity rates, tariffs, and incentives vary by country and site, and this guide does not cover them.
FAQ
How Much Energy Does a VFD Save on a Fan or Pump?
No single percentage applies. Public Japanese examples show about 40% for a 22 kW fan switched from damper control to a VFD at the same 80% airflow, and about 35% for a 37 kW pump at 85% speed. Your result depends on the current control method, flow profile, and static head.
Do the Affinity Laws Apply When a Pump Has Static Head?
Not for system savings. They still describe how the pump curve moves with speed, but the system curve no longer starts at zero, so flow does not fall in step with speed. At 50% flow in the J-Net21 example, power is about 24% of rated, not the 12.5% the cube law predicts.
Will a VFD Save Energy on a Fan That Always Runs at Full Speed?
No. With no room to reduce speed, the drive's own conversion losses increase power use. Japan's MOE suggests running a pump at rated flow on line power instead, a change for your electrical engineer to design.
How Much Power Does the VFD Itself Lose?
Public Japanese examples assume 90–95% drive efficiency. The DOE notes that efficiency falls as load falls, especially in smaller drives, so ask the supplier for part-load values.
Should I Use a VFD or Pump Staging?
A VFD suits systems with low static head, where most of the resistance is friction. For a large total head, such as water supply to a high level, Japan's MOE recommends staging. Using staging for coarse control and a VFD for fine trim is also an option.
Sources
- Fan affinity laws, damper comparison, and 22 kW fan example: Japan Ministry of the Environment, "Introduction of Variable Exhaust Fans" (Japanese), based on an ECCJ data sheet
- Pump flow, pressure, and power; static head; staging; line power at rated flow: Japan Ministry of the Environment, "Optimizing Flow and Pressure of Water Supply and Drainage Pumps" (Japanese)
- Valve control and 37 kW cooling water pump example: J-Net21, speed control of pumps and blowers, part 2 (Japanese)
- Pump with static head, numerical example, and effective range: J-Net21, why inverters save little on pumps with high static head (Japanese)
- Static and friction head, affinity law errors, resonance, motor insulation, and duration diagrams: US DOE, Hydraulic Institute, and Europump, "Variable Speed Pumping: A Guide to Successful Applications, Executive Summary"
- Variable and constant torque loads, part-load drive efficiency, and the 20 hp example: US DOE, Motor Systems Tip Sheet #11, "Adjustable Speed Drive Part-Load Efficiency"
- Variable-torque loads: Mitsubishi Electric, FREQROL-F800 series (Japanese)
- Top Runner motors and drive settings: Semiconductor Equipment Association of Japan, motor efficiency (Japanese)
- Japan's IE3 requirement: International Energy Agency, "Minimum Energy Efficiency of Motors"
- NEMA Premium and IE3: WEG, "Energy Efficiency Directives Around the World"
- Japan's harmonics guideline, JEAG 9702, and reactors: Japan Electrical Manufacturers' Association, harmonic suppression for general-purpose inverters and servo amplifiers, April 2022 (Japanese)
- IEEE 519-2022 limits and PCC: Comsys, "Power Quality: IEEE 519-2022"; IEEE Xplore, IEEE 519-2022
- NEMA MG 1 Parts 30 and 31: dV/dt Filter, "NEMA MG 1-2016 Standard for Voltage Stress in Motors and Drives"
- IEC TS 60034-25:2022: IEC Webstore
- Mains frequency by country: Miki Pulley, "Power Supply Situations Around the World"; Vietnam: LawNet, "Standards for Voltage and Frequency for Electricity Use in Vietnam"
- Minimum speed and static head: Pump Industry Magazine, "Pump Curves 16: How Low Can You Go?"
- Japan's 50/60 Hz boundary: KEK, "Japanese Electricity"
Original article in JapaneseThis guide is adapted from a MONOSCOPE article written for readers in Japan: インバータで省エネになる仕組み|ファン・ポンプの回転数と電力の3乗則
About the editor
 MONOSCOPE EditorFOUNDER & EDITOR
Spent about ten years at a plant equipment maker and a plant engineering company, proposing, designing, and commissioning equipment, then moved into web marketing. Now a web consultant for B2B manufacturers, helping them explain their products and technology. Licensed in Japan as an Energy Manager and a Third-Class Chief Electrical Engineer.
Has run an engineering blog since 2017 (500+ articles) and a Japanese YouTube channel with about 20,000 subscribers. Each English guide is written from the Japanese shop-floor point of view and checked against the cited standards.