Turbidity Units: NTU vs FNU, Calibration and 4-20 mA Scaling
Say a water treatment skid arrives from Japan. The datasheet for its online turbidity meter reads "0–20 度 (formazin), 4–20 mA," and the alarm is set at "5 度."
Your plant reports turbidity in NTU, and your lab meter reads FNU. The obvious question is how many NTU one Japanese "degree" equals, and whether the alarm still makes sense.
The short answer: there is no single conversion factor. A turbidity reading depends on the calibration standard (kaolin, formazin, or polymer beads) and on the optics (light wavelength and detector angle). Two readings can be compared only when both match.
Getting the units right also means checking the calibration and the 4–20 mA scaling between the meter and your control system.
This guide covers Japanese turbidity units, NTU vs. FNU (EPA 180.1 vs. ISO 7027), turbidity vs.
TSS, the main measurement principles, calibration, 4–20 mA scaling, and troubleshooting. It ends with a checklist, questions for the Japanese supplier, and a sample email.
Contents
- What Turbidity Measures (and What It Doesn't)
- Turbidity Units: Japanese "Degree" (do), NTU, FNU, and FAU
- Turbidity vs. TSS (Suspended Solids)
- How Turbidity Is Measured: The Main Principles
- Choosing a Measurement Method
- Sample Line Design for Online Turbidity Meters
- Turbidity Meter Calibration: Formazin, StablCal, and Other Standards
- 4–20 mA Scaling and Alarm Design
- Troubleshooting Turbidity Readings by Symptom
- Checklist: Reviewing a Japanese Turbidity Meter Spec
- Questions for the Japanese Supplier
- Limits of This Guide
- FAQ
- Sources
What Turbidity Measures (and What It Doesn't)
Turbidity describes how much a water sample scatters or weakens light. Silt, fine solids, and microorganisms change the path of light through the water, and a turbidity meter measures that change against a reference suspension.
It is not a particle count, and it is not the mass of solids in the water. Particle size, shape, and color all change how the sample responds to light.
Water with fine white particles and water with large dark particles can contain the same mass of solids and still give different scattered-light readings. Equal turbidity does not mean equal contents.
Turbidity is also separate from conductivity (dissolved ions) and pH (acidity or alkalinity). Clear water can still carry plenty of ions, so treatment plants combine several water quality parameters to fit what they need to remove and control.
Turbidity Units: Japanese "Degree" (do), NTU, FNU, and FAU
Japanese specifications often give turbidity in 度 (do, "degree"). The number alone is not enough: you also need to know which standard defined the degree. Kaolin, formazin, and polystyrene-type particle standards each set a different reference.
- Degree (kaolin): 1 degree is the turbidity of purified water containing 1 mg of standard kaolin per liter. That 1 mg/L is a reference to the standard material, not the actual mass concentration of particles in your sample.
- Degree (formazin): formazin is a polymer suspension used to calibrate turbidity meters. It is still a comparison against a standard. Kaolin degrees and formazin degrees give different values on the same sample, and the ratio between them is not constant.
- Degree (polystyrene): polystyrene-type particle standards are used in Japan's official tap water testing. The test method set by Japan's Minister of the Environment combines standard particles of several sizes.
Figure 1 lists the units you are likely to see on Japanese and international instruments. Read each unit together with its standard and its optics.
Figure 1: Read Each Turbidity Unit with Its Standard and Optics
Calibrating with the same standard does not guarantee the same response to real samples.
| Unit | Standard and optics | What to check before comparing |
|---|---|---|
| Degree (kaolin) | Compared with a kaolin standard | Not the same as particle mass concentration in the sample |
| Degree (formazin), FTU | Formazin standard; record the optical layout in the spec as well | Match the detection method, not just the standard |
| Degree (polystyrene) | Compared with polystyrene-type standard particles | Used in Japan's official tap water testing, which follows the specified method |
| NTU | Typically white light, 90° scatter | Check the method (e.g., EPA 180.1) and the instrument specs |
| FNU | Near-infrared light, 90° scatter | Corresponds to ISO 7027 measurement conditions |
| FAU | Near-infrared light, attenuation (detector in line with the beam) | For high turbidity; not interchangeable with FNU |
Some instruments keep older unit labels, so do not identify the optics from the unit shown on the display alone.
NTU vs. FNU: EPA 180.1 vs. ISO 7027
NTU (nephelometric turbidity unit) is the unit for white-light nephelometers, with US EPA Method 180.1 as the usual reference. FNU (formazin nephelometric unit) belongs to near-infrared instruments built to ISO 7027-1. Both measure light scattered at 90° and are calibrated with formazin; the light source is the main difference.
The table below summarizes the optical conditions. The values come from the sources listed at the end of this article. For design or compliance work, check the current text of each standard.
| EPA 180.1 (NTU) | ISO 7027-1 (FNU / FAU) | |
|---|---|---|
| Light source | Tungsten lamp, color temperature 2200–3000 K (white light) | Near-infrared, 860 nm with a bandwidth of 60 nm or less (secondary sources) |
| Detector | 90° to the beam (±30°), spectral peak 400–600 nm; total light path 10 cm or less | 90° (±2.5°) for FNU; in line with the beam (attenuation) for FAU |
| Range | 0–40 NTU; higher values by dilution | Nephelometry typically below 0.05 up to 400 FNU; attenuation typically 40–4,000 FAU |
| Sample color | More affected by sample color | Less affected by color, because dissolved color absorbs less in the near-infrared |
| Where common | Drinking water and wastewater in North America | Europe and Asia-Pacific |
ISO 7027-1 treats NTU and FNU as numerically equivalent within the same scattered-light method. That is not the same as converting readings between instruments with different optics. In natural water, particle size, shape, and color change the readings, so a white-light meter and an infrared meter often disagree on the same sample.
For this reason, USGS and ASTM D7315 recommend reporting each technology in its own unit (NTU, FNU, FNRU, FAU, FBU, and others). Older instruments, however, often displayed "NTU" whatever their optics. Treat these two cases separately:
- Same meter, new label: the display is switched from NTU to FNU, but the optics have not changed.
- Different meter: the replacement has a different light source or detector angle, so readings on real samples can shift even after calibration.
Converting Japanese Degrees to NTU
No common factor answers "how many NTU is one degree." Even a formazin-based degree lines up with NTU only when the optics also match, and a kaolin degree or a transmitted-light reading is a different measurement. What you can do:
- Find out which standard the Japanese value is based on (kaolin, formazin, or polystyrene).
- Find out which optics the instrument uses (transmitted, 90° scatter, ratio, integrating sphere, or surface scatter) and the light source.
- If the old and new instruments differ, run both on the same samples for a period and compare.
Japan's Drinking Water Limit: 2 Degrees
In Japan, the tap water quality standard for turbidity is 2 degrees or less. A separate water quality management target sets 1 degree or less. The two are different categories, so do not mix them up.
Meeting the turbidity limit alone does not make water safe to drink. Drinking water standards also cover microorganisms, chemicals, and other parameters.
For comparison, US rules for conventional and direct filtration set combined filter effluent limits of 0.3 NTU in at least 95% of monthly measurements and 1 NTU at any time. These limits apply at a different point in the process, so they cannot be compared directly with Japan's tap water standard.
Neither limit carries over to plant wastewater or process liquids. Legal drinking water tests, process control limits, and effluent permits each follow their own scope and specified method.
Turbidity vs. TSS (Suspended Solids)
Total suspended solids (TSS, called SS in Japan) is the mass of suspended matter per volume of sample. You filter the sample by a set procedure, then dry and weigh the residue. Turbidity is an optical reading, so keep the two separate.
Some turbidity meters display SS in mg/L, but they do not dry or weigh anything. They convert turbidity to SS with a relationship derived from real samples.
Here is a fictional example. Let x be turbidity (degrees) and y be SS (mg/L), and suppose real samples gave y = 2 + 1.5x. For that sample type and range, a reading of 20 degrees gives an estimated SS of 32 mg/L.
The coefficients 2 and 1.5 are made up for illustration. If you take a correlation built on muddy river water and apply it to process water with oil or pigment, the difference in particles shows up as conversion error.
When you build a correlation, measure turbidity and SS on the same samples, in pairs, across the full control range. Check the ends of the range and upset conditions, not just the part that looks linear. Changes in chemicals or raw materials can change what the reading means, so record the process and the valid range with the equation.
How Turbidity Is Measured: The Main Principles
Turbidity methods are usually grouped as visual, transmitted light, scattered light, and integrating sphere. All compare the sample with a reference turbidity, but they look at different parts of the light and collect it from different directions.
Visual turbidity compares a sample and a standard in matched comparison tubes. Light source, background, and viewing direction must be controlled. It is not the same as holding a bottle up to the light.
In Japan, JIS K 0101 (industrial water) and JIS K 0102 (industrial wastewater) have been merged into the JIS K 0102 series. General physical and chemical tests, including turbidity, are in JIS K 0102-1:2021 and its Amendment 1:2023. Automatic turbidity meters have their own standard, JIS K 0801; its current edition and requirements should be confirmed with the supplier or the Japanese Standards Association.
Japan's tap water testing uses the method set by the Minister of the Environment. Knowing the measurement principle is one thing; complying with a specified test method is another. Let the purpose of the test decide which method applies.
In any optical meter, the positions of the light source, sample, and detector determine the reading.
Transmitted Light (Turbidimetry)
A transmitted-light meter passes light through the sample and measures how much reaches a detector on the opposite side. Particles scatter light out of the straight path, so less reaches the detector as turbidity rises.
These meters are used for medium to high turbidity, but the usable range depends on the path length and detector. Because the meter reads light loss, absorption by things other than particles and fouling on the optical windows also affect it.
Figure 2: Transmitted Light Measures the Loss of Light Reaching the Far Side
Light lost to sample color or window fouling adds to the loss caused by particles.
In nearly clear water, particles change the transmitted light only slightly. The signal can get lost against the background light level and cell-to-cell differences, which is why low turbidity is hard to measure this way.
At the other extreme, when the water is so turbid that almost no light gets through, there is little change left to read. "Suited to high turbidity" does not mean unlimited, so check the instrument's effective range.
- Color: colored water with few particles can still lower the transmitted light through absorption. Compare the meter's response on real samples so you do not mistake a color change for a turbidity change.
- Cell condition: fingerprints, water drops, and fine scratches on the cell shift the reading. Before suspecting the sample, re-measure with a clean cell in the same orientation and conditions.
- Not a chemical analysis: colorimetric analyzers (for example, silica analyzers) also measure transmitted light, but they read a color produced by a chemical reaction to find a specific component.
Scattered Light (Nephelometry)
A scattered-light meter measures light that particles deflect, using a detector at a fixed angle. The common side-scatter design detects light at 90° to the incident beam.
In nearly clear water, each added particle increases the scattered light in a way that is easy to detect, so this method is used for low turbidity. It reads a different kind of signal than the small drop in transmitted light.
Scattered light is not just a mirror-like reflection in one direction. Particles send light in many directions, and the angle the meter picks changes how it responds to particle size and other properties.
As turbidity rises, less incident light reaches the measuring zone, and scattered light is weakened on its way to the detector. The relationship between turbidity and detected light then stops being simply proportional.
A reading below full scale does not prove the measurement is correct. Evaluate the system's response, including multiple scattering, and dilute according to the instrument specs or test method.
Near-infrared light can reduce the effect of visible color in some cases. Differences in particle absorption and properties remain, so test the meter on real samples of the water you will measure.
Figure 3: Separate Detectors for Side Scatter and Straight-Through Light
S is measured at 90° and T along the beam. Ratio instruments use both.
Ratio Method (Scattered and Transmitted Light)
A ratio meter measures both transmitted and scattered light and uses their ratio. If lamp brightness or sample color affects both signals equally, the ratio cancels much of that effect.
This does not make the ratio method the most accurate choice for every sample. Choose the method to suit the particles, sample color, required range, and any specified test method. ASTM D7315 and USGS report these designs in their own units, such as NTRU (white light) and FNRU (near-infrared).
A simple teaching example: a scattered signal of 20 and a transmitted signal of 80 give a ratio of 0.25. If the lamp dims and both fall to 0.8 times, the signals become 16 and 64, and the ratio stays at 0.25.
Now add a bubble signal of 4 to the scattered side only. The ratio becomes 24 ÷ 80 = 0.30. A ratio does not correct every disturbance, only those that act equally on both signals.
Real instruments are calibrated with their own optical layout and correction methods. Do not assume a simple S/T formula means every model measures the same range with the same accuracy; compare the performance of each model.
Integrating Sphere and Surface Scatter
An integrating sphere meter collects light that has passed through the sample inside a sphere whose inner wall reflects light diffusely. It collects light over a wider range of directions than a single-angle scatter meter.
It evaluates turbidity from quantities such as the ratio of scattered light to total transmitted light. To understand the principle, look at which light components the instrument separates and detects, not just the fact that it has a sphere.
Figure 4: An Integrating Sphere Collects Light by Diffuse Reflection
Light leaving the sample reflects around the sphere and reaches the detector. Conceptual cross-section of the light path.
A surface-scatter meter detects light scattered at or near the water surface, typically from above. Designs whose optics are not immersed in the sample avoid fouling of wetted cell windows.
Foam or floating debris on the surface still affects the reading. Yokogawa's technical note on bubbles describes signal processing that suppresses intermittent bubbles, along with the conditions where it applies.
Non-contact optics do not mean the whole instrument is maintenance-free. Keep the sample flow, water level, and drain stable, and keep foam from building up on the measuring surface.
Choosing a Measurement Method
Start with the purpose and the turbidity range you need. Drinking water testing, raw water monitoring, process water control, and monitoring of highly turbid wastewater each need different performance and face different constraints.
If a regulation or contract specifies the method, compliance with that method is the starting point. A meter with a wider range still cannot produce an equivalent compliance value if it uses a different method.
For process monitoring, find out how turbid the water gets at startup and during upsets, not just in normal operation. A narrow range set for normal values cannot record how bad an upset was.
When you replace a meter, run the old and new units on the same samples for a period to check data continuity. Agreement on standards is not enough; also record periods when the particles themselves change, such as rainfall or a switch in raw materials.
If the comparison shows a difference, trace the method behind the old control limits before carrying them over. Separating "the process changed" from "the meter responds differently" keeps you from inheriting a wrong alarm setpoint.
In the specification, state more than the upper and lower turbidity limits:
- The calibration standard and the optical method
- Water temperature and pressure at the measuring point
- Output scaling (what the 4–20 mA endpoints mean)
- How the output behaves during maintenance
With these in the spec, everything from delivery to the side-by-side comparison runs under the same conditions.
Method Comparison
The table summarizes what each method reads and the conditions to check.
| Method | Light it reads | Typical use | Conditions to check |
|---|---|---|---|
| Visual | Appearance of standard and sample | Comparison tests by a specified procedure | Lighting, background, viewing conditions |
| Transmitted light | Loss of straight-through light | Medium to high turbidity monitoring | Color, window fouling, path length |
| Scattered light | Light scattered at a fixed angle | Measurements that include low turbidity | Wavelength, detector angle, multiple scattering |
| Integrating sphere | Transmitted and scattered components collected by a sphere | Sample measurement by a specified method | Sphere, optics, calibration conditions |
| Ratio (scattered/transmitted) | Ratio of scattered to transmitted light | Monitoring with reduced color effects | Disturbances that do not act on both signals |
| Surface scatter | Light scattered near the water surface | Continuous measurement without wetted windows | Foam, floating debris, flow, water level |
Match the method to the sample:
- Low turbidity: zero stability, blocking stray light, and a clean cell are key. Look at how much readings vary around your target value, not just the smallest display digit.
- High turbidity: how far light penetrates, detector layout, and settling speed all matter. As part of the monitoring design, decide whether an over-range reading should hold at the upper limit or signal a fault.
- Colored water: evaluate particle increases and dissolved dye increases separately. Even with correction, the response changes when color or particles change, so test both normal water and upset water.
- Oil droplets or flocs: mixing intensity can change the sample. Record test conditions and keep handling the same from sampling to measurement.
Sample Line Design for Online Turbidity Meters
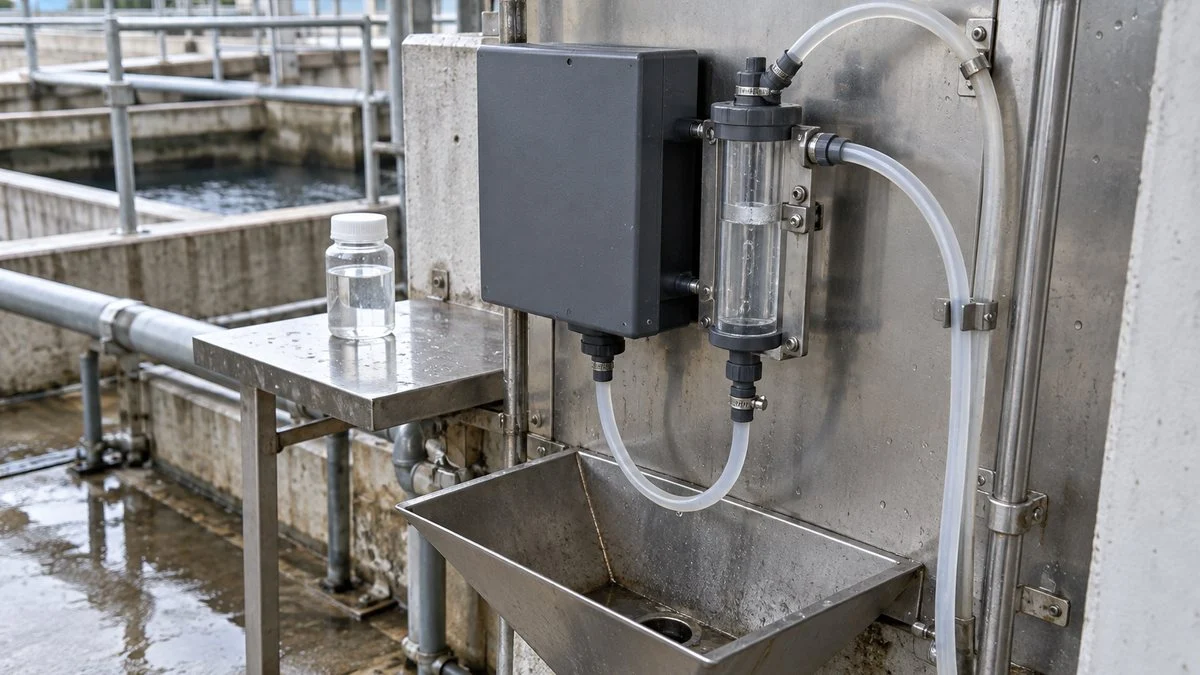
An online turbidity meter measures only the water that reaches its sensor. If particles settle or stick in the sample line, the meter sees different water from the process itself.
Choose a sampling point where representative process water flows. A tank corner and an outlet pipe carry particles differently, so check for dead zones and settling, not just ease of installation.
A long, narrow sample line adds delay and gives particles more chances to settle or stick. Plan the length, diameter, and flow together, and leave a path for flushing and clog checks.
Figure 5: A Sample Line Must Keep Particles Representative and Remove Bubbles
Treat everything from the process tap to the drain as one measuring system. Settling, bubbles, and dead volume all affect the reading.
Conceptual layout; follow the flow and pressure ranges of the specific instrument. Design the debubbler so particles do not settle in it.
Dissolved gas that comes out of solution when pressure drops, or air drawn in at pumps and fittings, forms bubbles that scatter light. The reading can jump even though the particle content has not changed.
To remove bubbles, stabilize flow and pressure and use a separator designed for the instrument. Letting the sample stand too long, however, also settles the particles and changes the turbidity you want to measure.
More flow is not always better: excessive flow causes bubbles and an unstable water surface. Keep the flow and pressure within the sensor's specified range, and adjust until the supply is steady at that setting.
Sample line delay also slows alarm response. If the line and cell hold a large volume, the process change takes time to show up, even with a fast sensor.
When you compare lab results with online readings, pair samples taken at the same time. Allow for the delay from the sampling point to the cell, so you do not call a difference "meter error" when the two values came from different water during a change.
Turbidity Meter Calibration: Formazin, StablCal, and Other Standards
Calibration matches the meter's response to a defined standard. It is not adjusting the meter until the sample shows the value you want. Record the standard's type, value, and lot each time.
- Start clean. Clean the optics and sample path, then let the reading settle on the specified zero water. If you set zero with a fouled window, the fouling becomes part of the reference.
- Span with the specified standard. Use the standard solution or standard plate the manufacturer or method specifies. Common choices are formazin, stabilized formazin (for example, Hach StablCal), and polystyrene-type particle standards. For continuous tap water monitoring, Japan's method also allows calibration with a standard plate; confirm that the plate agrees with the standard solution before relying on it.
- Check near your control values. Two matching points (zero and a high value) do not prove the meter is fit for purpose in between. Verify the response near the values you actually control to.
- Record before and after. Log readings before and after cleaning, and before and after calibration, separately. This shows whether cleaning alone restored the reading or zero and sensitivity had also drifted, and helps you set maintenance intervals.
Diluting a Standard
When you prepare a series of standards by dilution, link the stock value, the volume you take, and the final volume. The final volume is the total after making up to the mark with water.
Figure 6: Making a 10-Degree Standard from a 100-Degree Stock
Take 10 mL of stock and make it up to 100 mL total to get 10 degrees. In practice, follow the specified standard and procedure.
Adding 100 mL of water to 10 mL of stock gives about 110 mL, not 100 mL. Making up to the mark and adding a fixed volume of water are different operations.
A suspension that has settled in storage will give the wrong value if you take only the top layer. Follow the specified mixing method and expiry date, and keep containers and tools from adding foreign particles.
Preparing formazin from raw reagents involves hazardous chemicals. One of them, hydrazine sulfate, is highly toxic, and formazin itself can contain residual hydrazine sulfate. Do not prepare it from general maintenance notes; follow the specified test method, the safety data sheets, and your site's chemical handling procedures.
4–20 mA Scaling and Alarm Design
When the meter sends its value to a control system, the display range and the transmitted range must match. With 4–20 mA, the meter and the receiving system must agree on what turbidity each endpoint represents.
In a fictional case, 0–20 degrees is scaled to 4–20 mA, so 12 mA is the midpoint, 10 degrees. If the receiving side is still set to 0–100, the same 12 mA shows up as 50.
Check the unit label too. If the transmitter outputs formazin degrees and the control system tag says NTU, the number may look right while the basis is different. A correct signal also does not prove the sampling or optics are correct, so check the sample side and the signal side separately.
Use these points when you set up alarms:
- Range: cover startup and upset levels, not just normal values.
- Over-range and fault signals: ask whether the output holds at the upper limit or goes to a fault current. Some transmitters use NAMUR NE 43 signal levels, but the actual currents depend on the device and its settings, so confirm them with the supplier.
- Averaging and bubble rejection: stronger filtering hides short spikes but also delays real changes. Set the response time and false-alarm suppression to fit what the alarm is for.
- Maintenance status: record meter faults and cleaning status alongside turbidity. If normal readings and readings taken during maintenance are logged the same way on the control system, someone will later misread a water quality change.
- Instantaneous value: turbidity shows the water at that moment. Integrating it over time does not give the mass of particles. If you need a pollutant load, define flow and concentration properly.
Troubleshooting Turbidity Readings by Symptom
Work from the symptom to the likely cause. Bubbles, fouling, the standard, and the sample line are the usual places to look.
| Symptom | Check first | Notes |
|---|---|---|
| Short spikes | Bubbles, large particles passing through, stray light | If spikes line up with process flow or pressure changes, suspect the sample line. |
| Gradual drift | Window fouling or deposits, condition of the standard, light source aging | Record the reading before cleaning, so you do not lose the cause by resetting zero and span at once. |
| Low only right after cleaning | Rinse water left in the cell diluting the sample | Log when the sample switched back and how long it took to settle; flag cleaning periods separately. |
| Off from lab results by a constant ratio | Standard basis, optical method, output range setting | Confirm both sides measure the same quantity before adjusting sensitivity. |
| Poor repeatability on the same sample | Settling, flocculation, cell orientation, bubbles | Fix the mixing procedure and the wait time before measuring. |
| Relationship breaks after a process change | Particle properties or color changed | Do not assume a meter fault; re-measure turbidity and other needed parameters on real samples. |
Checklist: Reviewing a Japanese Turbidity Meter Spec
Use this list when you receive a datasheet, P&ID, or operating data from Japan.
- Unit: 度 (degree), NTU, FNU, FTU, or FAU, and whether the label reflects the actual optics
- Standard: kaolin, formazin, stabilized formazin, polystyrene-type particles, or a standard plate
- Optics: transmitted, 90° scatter, ratio, integrating sphere, or surface scatter; light source (white light or near-infrared)
- Method reference: JIS K 0102-1, JIS K 0801, Japan's tap water test method, EPA 180.1, or ISO 7027-1
- Range: covers normal, startup, and upset levels
- Output: 4–20 mA endpoints, over-range behavior, fault current, and behavior during maintenance
- Control system: same range and unit label on the receiving side
- Alarms: setpoints, the method they were based on, and averaging or bubble-rejection settings
- Sample line: sampling point, flow and pressure range, debubbler, delay time, drain
- Calibration: standard values, frequency, verification near control values, and record format
- SS display (if used): correlation equation, the samples behind it, and its valid range
Questions for the Japanese Supplier
Ask these before the equipment ships, or before you move any alarm setpoint into your own system.
- Which standard is the turbidity value based on: kaolin, formazin, or polystyrene?
- Which measurement principle and light source does the meter use? Is it built to JIS K 0801, ISO 7027-1, or another method?
- Can the meter display and transmit in NTU or FNU? If so, does that change the optics or only the label?
- What turbidity values correspond to 4 mA and 20 mA? What current does the meter output when over range and when in fault?
- What does the output do during cleaning and calibration (hold, last value, or live)?
- Which standard and calibration points do you recommend, and how often?
- How were the alarm setpoints decided, and which method and unit were they based on?
- If the meter displays SS in mg/L, which samples was the correlation built on, and over what range?
Sample Email to the Supplier
You can adapt this short email. Replace the bracketed parts with your own details.
Subject: Turbidity meter [tag no.] – units, calibration, and 4–20 mA scaling
Dear [Name],
We are integrating the turbidity meter [model / tag no.] into our control system, and our plant reports turbidity in [NTU / FNU]. Could you please confirm the following?
1. The standard behind the "度" value (kaolin, formazin, or polystyrene) and the measurement principle and light source.
2. Whether the meter can output in NTU or FNU, and whether this changes the optics or only the display label.
3. The turbidity values at 4 mA and 20 mA, and the output current when over range, in fault, and during maintenance.
4. The recommended calibration standard, calibration points, and frequency.
5. The basis for the alarm setpoint of [value] 度.Thank you for your help.
Best regards,
[Your name]
[Company]
Limits of This Guide
- Optical conditions for EPA 180.1 and ISO 7027-1 are summarized from public sources and manufacturer documents. For compliance or design, check the current standard text.
- Regulatory testing must use the method the regulator approves (for example, the methods listed in 40 CFR in the US, or Japan's tap water test method). This guide does not decide which method applies to your site.
- The current edition and requirements of JIS K 0801 were not confirmed; ask the supplier.
- All equations and numbers in the worked examples (the SS correlation, the S/T ratio, the 4–20 mA case) are fictional.
- Turbidity alone does not cover dissolved components. Cooling water and boiler water need their own control parameters, such as cycles of concentration and blowdown control.
FAQ
How Many NTU Is One Japanese Turbidity Degree?
There is no fixed conversion that works for every type of water. Compare readings only when the standard and optics match. Switching the display label on the same meter is a different case from replacing it with a meter that has a different light source or detector angle.
Is NTU the Same as FNU?
Numerically, yes: ISO 7027-1 treats them as equivalent within the same scattered-light method. On real samples, not necessarily: NTU comes from white-light meters and FNU from near-infrared meters, and particle size and color can make them read differently.
Is Turbidity in mg/L the Same as TSS in mg/L?
No. A kaolin-based turbidity expressed as mg/L and the gravimetric mass of suspended solids are different quantities. To estimate TSS from turbidity, use a correlation built on your own samples and stay within its valid range.
Why Does My Online Turbidity Meter Suddenly Read High?
Besides real particle increases, common causes are bubbles, floating debris, stray light, and changes in the sample line. Compare the spike with process data from the same time and re-measure to separate a water change from a measurement problem.
Why Do Field Readings Differ When the Calibration Checks Out?
Agreement on standards does not guarantee the same response to real particles and color, which varies by method. Sampling time and settling also matter, so measure the same sample under the same conditions before comparing.
Sources
- Turbidity units in Japan (kaolin and formazin degrees, 1 mg/L kaolin definition, EPA optical conditions): Yokogawa, "Turbidity definitions and units" (Japanese)
- NTU vs. FNU optics, unit naming, color interference, regulatory methods: US EPA, "Field Turbidity Measurements" operating procedure
- Unit key (NTU, FNU, FAU, FNRU, FBU) and regional use: Thermo Fisher Scientific, "Turbidity Units – A Cloudy Issue"
- USGS reporting units: USGS Office of Water Quality Technical Memorandum 2004.03
- EPA Method 180.1 range and optics: NEMI, EPA-NERL 180.1 method summary; Health Canada, Guideline Technical Document – Turbidity
- ISO 7027-1 scope, NTU/FNU equivalence, ranges: ISO 7027-1:2016; Standard Norge, ISO 7027-1:2016
- ISO 7027 wavelength and detector angle (secondary): Hanna Instruments, HI88713 ISO turbidity meter
- NTU and FNU in natural water: US Bureau of Reclamation / California DWR memo on NTU and FNU; Campbell Scientific, turbidity units FAQ (Japanese)
- Japan's tap water standards for turbidity: Ministry of the Environment, Japan, drinking water quality standards (Japanese)
- Japan's tap water test methods: Notification No. 261, water quality test methods (Japanese)
- US combined filter effluent limits: eCFR, 40 CFR 141.551
- JIS K 0102 series: JEMAI, merger and division of the JIS K 0102 series (Japanese); Japanese Standards Association, JIS K 0102-1:2021 (Japanese); JIS K 0102-1 Amendment 1:2023 (Japanese)
- Ratio method: HORIBA, light transmission and scattering method (Japanese); Yokogawa, technical information on transmitted-scattered light turbidimeters (Japanese)
- Surface-scatter meters and bubbles: Yokogawa, bubble countermeasures for surface-scatter turbidimeters (Japanese)
- Turbidity vs. SS and SS conversion: Yokogawa, difference between turbidity and SS (Japanese); Kasahara Chemical Instruments, SS conversion using sample correlation (Japanese)
- StablCal and formazin hazards: Hach, StablCal turbidity standard; Hach Method 10258
- NAMUR NE 43 signal levels: Test & Measurement Tips, "What's the difference between live zero and dead zero?"
Original article in JapaneseThis guide is adapted from a MONOSCOPE article written for readers in Japan: 濁度とは?度・NTU・FNUの違いと測定原理、選び方・校正の実務
About the editor
 MONOSCOPE EditorFOUNDER & EDITOR
Spent about ten years at a plant equipment maker and a plant engineering company, proposing, designing, and commissioning equipment, then moved into web marketing. Now a web consultant for B2B manufacturers, helping them explain their products and technology. Licensed in Japan as an Energy Manager and a Third-Class Chief Electrical Engineer.
Has run an engineering blog since 2017 (500+ articles) and a Japanese YouTube channel with about 20,000 subscribers. Each English guide is written from the Japanese shop-floor point of view and checked against the cited standards.