Cooling Tower Cycles of Concentration and Blowdown Formula
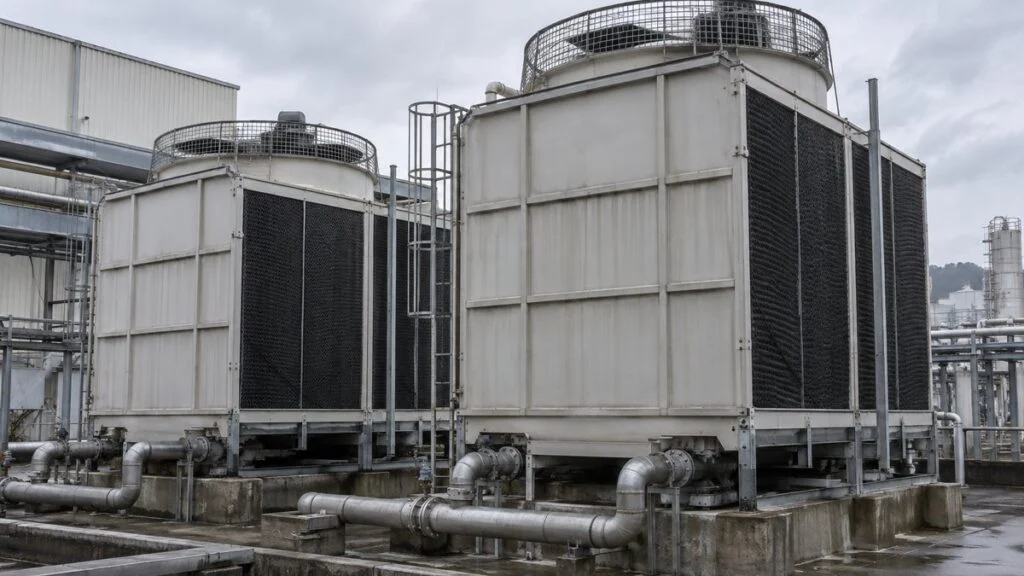
The manual for a Japanese chiller or cooling tower says the cooling water "must satisfy JRA GL-02." A Japanese specification sheet lists noshuku baisu (濃縮倍数) of 3 and a blowdown rate in kg/h.
Meanwhile, your water treatment vendor wants to run the tower at 5 or 6 cycles to save water. Before anyone changes a setpoint, you need to know what the number means and where it comes from.
Cycles of concentration (濃縮倍数, noshuku baisu) is how many times more concentrated the dissolved solids in the circulating water are than in the makeup water. Once you pick a target, you can calculate the blowdown and makeup water a tower needs from its evaporation and drift.
This guide explains how to set the target, works through evaporation, drift, blowdown, and makeup with one numerical example, and compares the Japanese JRA guideline with an overseas manufacturer's limits. It ends with a checklist and questions to send to the Japanese side.
Contents
What Cycles of Concentration Means
Cycles of concentration is the concentration of a given substance in the circulating water divided by its concentration in the makeup water. If the makeup water has 10 mg/L of chloride and the circulating water has 30 mg/L, the system is at 3 cycles. It is a ratio, not a count of how many times the water has gone around the loop.
Figure 1 shows the water that circulates through the system and the water that enters and leaves it.
Figure 1: Circulating Water vs. Water Entering and Leaving the System
Separate from circulation L through the heat exchanger, makeup M replaces the losses to evaporation E, drift W, and blowdown B.
On a phone, scroll the figure sideways.
Conceptual diagram; circulation is shown as a single representative flow. In a closed-circuit tower, concentration control applies to the spray water that contacts the air.
A pump sends water from the basin to the heat exchanger, where it picks up heat from the process and returns to the tower. Inside the tower, the water contacts air, part of it evaporates, and the cooled water falls back into the basin.
Evaporation removes mostly pure water. Calcium, chloride, and other dissolved substances stay behind, and every time makeup water replaces the lost volume, it brings in more of them. Without blowdown, their concentration keeps rising.
Blowdown drains concentrated circulating water, and the dissolved solids leave with it, so makeup increases by the same amount. Level control maintains the water quantity, while concentration control maintains water quality. Both act on the makeup system, but they do different jobs.
For the same evaporation, a lower target means more blowdown and more makeup. At a plant, that changes not only the water bill but also wastewater treatment and chemical costs, which makes this number a direct driver of cooling system operating cost.
In an open tower, the water that cools the equipment is the same water that contacts the air and concentrates. A closed-circuit tower keeps the process fluid inside a coil and sprays separate water over it, so concentration control applies to that spray water.
Measured Cycles vs. Target Cycles
Measured cycles come from analyzing the water at a given moment. Target cycles are an operating condition set from water quality, materials, and the treatment program. A tower with a target of 3 will not read exactly 3 at all times.
To measure cycles, use a substance that the system itself does not add or remove. Calcium can precipitate as scale, and iron increases with corrosion, so using either one alone gives a ratio that water exchange cannot explain.
Day-to-day control typically relies on the conductivity ratio, with the trend checked against periodic chemical analysis. Conductivity reflects the ions in the water, so it also shifts when chemicals are dosed or the water source changes.
How to Set Target Cycles
Set the target by comparing the makeup water analysis with the control limits for the cooling water system. Give the cooling tower manufacturer and the water treatment company the materials (including the heat exchanger), water temperatures, and treatment method, and agree on a value the whole system can accept.
The starting point is simple. For each parameter, divide the circulating water limit by the makeup water concentration. Running at the smallest of these results keeps every parameter within its limit.
Figure 2 applies this method to a fictional makeup water analysis, using the JRA GL-02 circulating water limits described in the next section.
Figure 2: The Strictest Parameter Sets the Target (Fictional Example)
Allowable cycles = JRA circulating water limit ÷ makeup water value. Here, alkalinity and silica limit the system to 2.5 cycles.
Fictional makeup water: 200 µS/cm, chloride 25 mg/L, total hardness 60 and calcium hardness 45 mg CaCO₃/L, acid consumption 40 mg CaCO₃/L, silica 20 mg SiO₂/L. Limits: 800 µS/cm, 200, 200, 150, 100, and 50 respectively. Not a recommendation for any real system.
This division alone is not a water treatment plan. Calcium carbonate scale, for example, depends not only on hardness but also on pH, alkalinity, and the temperature near the heat transfer surface.
The goal of water quality control is to prevent scale, corrosion, and biological fouling, not to make the numbers line up. Evaluate any proposal to raise cycles against those risks as well as the water it saves.
When deposits coat heat transfer surfaces, the system has to work harder to reject the same heat. Iron also needs care: it increases with corrosion inside the system, so check its source as well as its concentration.
Japanese water quality tables have separate columns for cooling water and makeup water, and which column applies depends on the application and temperature. Japanese tower manufacturers such as Kuken Kogyo also publish their own water quality data, so read the table that matches your equipment's specifications.
Filtration vs. Removing Dissolved Solids
Sand filters and side-stream filters remove suspended matter such as sand and rust from the circulating water. Ordinary particle filtration does not remove dissolved chloride or hardness.
Water softeners target hardness, such as calcium and magnesium. Reverse osmosis (RO) and other demineralization processes remove different substances, so choose pretreatment that addresses the parameter actually limiting your cycles.
A strainer that catches large debris does not remove dissolved salts either. Do not assume one added unit will raise the target. Judge the effect from water quality data before and after treatment.
To judge whether the investment pays off, subtract the cost of power, maintenance, chemicals, and the water used for regeneration or cleaning from the makeup and wastewater savings. Higher cycles alone do not guarantee lower total operating cost.
Boilers also concentrate solids through evaporation, but their operating temperatures and water quality requirements differ from those of cooling towers. Keep the two separate when reading specifications.
JRA GL-02 vs. Overseas Guidelines
Manuals for Japanese refrigeration and air conditioning equipment commonly cite JRA GL-02-1994, published by the Japan Refrigeration and Air Conditioning Industry Association (JRAIA). An English edition (JRA GL-02E) exists, and manufacturer manuals cite it as the "Guideline of Water Quality for Refrigeration and Air Conditioning Equipment."
The table below shows the main items for a recirculating cooling water system, as reproduced in published secondary materials rather than the purchased standard itself. The guideline also covers once-through cooling water, chilled water, and hot water, which are not shown here.
| Item (at 25°C where noted) | Circulating water | Makeup water |
|---|---|---|
| pH (25°C) | 6.5–8.2 | 6.0–8.0 |
| Electrical conductivity (25°C) | ≤80 mS/m (≤800 µS/cm) | ≤30 mS/m (≤300 µS/cm) |
| Chloride ion, mg Cl⁻/L | ≤200 | ≤50 |
| Sulfate ion, mg SO₄²⁻/L | ≤200 | ≤50 |
| Acid consumption (pH 4.8), mg CaCO₃/L | ≤100 | ≤50 |
| Total hardness, mg CaCO₃/L | ≤200 | ≤70 |
| Calcium hardness, mg CaCO₃/L | ≤150 | ≤50 |
| Ionic silica, mg SiO₂/L | ≤50 | ≤30 |
| Iron, mg Fe/L (reference item) | ≤1.0 | ≤0.3 |
| Copper, mg Cu/L (reference item) | ≤0.3 | ≤0.1 |
Three notes attached to the reproduced table matter when you apply it outside Japan:
- Units: Japanese documents state conductivity in mS/m. Multiply by 10 to get µS/cm, the unit common in US documents (80 mS/m = 800 µS/cm).
- Closed-circuit towers: the spray water and its makeup follow the recirculating cooling water limits. The closed-loop water and its makeup follow the hot water limits.
- Source water: the limits assume tap water, industrial water, or groundwater as the source. Pure water, reclaimed water, and softened water are excluded, so a site that softens its makeup needs separate guidance.
"Acid consumption (pH 4.8)" (酸消費量, sanshohiryo) is the Japanese term that corresponds to M-alkalinity (total alkalinity).
How Overseas Guidance Differs
We found no single overseas standard that maps one-to-one onto JRA GL-02. Instead, tower manufacturers publish their own limits by material, and the water treatment company sets its program within them.
As one example, the table below compares JRA GL-02 with the circulating water guidelines that Baltimore Aircoil Company (BAC) publishes for its Baltiplus-protected (galvanized-type) equipment in Europe.
| Item | JRA GL-02 circulating water | BAC, Baltiplus protection |
|---|---|---|
| pH | 6.5–8.2 | 6.5–9.0 |
| Conductivity | ≤800 µS/cm | 2,400 µS/cm |
| Chloride, mg/L | ≤200 | ≤250 |
| Sulfate, mg/L | ≤200 | ≤250* |
| Total hardness, mg CaCO₃/L | ≤200 | 50–600 |
| Alkalinity, mg CaCO₃/L | ≤100 | ≤500 (total alkalinity) |
| Silica | ≤50 mg SiO₂/L | Not listed |
*BAC allows higher sulfate if chloride plus sulfate stays at or below 500 mg/L. BAC also lists higher limits for stainless steel and other materials, and it asks for a minimum makeup hardness of 30 mg CaCO₃/L rather than fully softened water.
The two documents are not directly comparable. JRA GL-02 is written for the refrigeration and air conditioning equipment connected to the tower, including chiller condensers, while BAC's limits are written for its own tower materials. When a Japanese chiller sits on a non-Japanese tower, both sets of limits apply, and the stricter value for each item governs.
BAC itself says the same thing: if other components need stricter water quality, follow the stricter guideline. The US Department of Energy (DOE) notes that many systems run at two to four cycles and that six or more may be possible.
Calculating Evaporation, Drift, Blowdown, and Makeup
Express evaporation E, drift W, blowdown B, and makeup M in the same unit. This example uses kg/h, with US units in parentheses. Cycles of concentration N has no unit.
The calculation assumes steady operation, with the basin volume and concentration roughly constant. It also assumes no leaks or overflow, and that drift and blowdown have the same concentration as the circulating water. The example conditions are:
- Circulating flow L: 100,000 kg/h (about 440 gpm)
- Tower inlet-to-outlet temperature difference (range) ΔT: 5 K (9°F)
- Specific heat of water cp: 4.18 kJ/(kg·K)
- Latent heat of vaporization r: 2,400 kJ/kg (assumed value for estimating)
- Drift rate: 0.05% (assumed for the calculation)
- Target cycles of concentration N: 3
These values only illustrate the procedure. They are not the performance of any specific product.
For a real tower, use the circulating flow at the actual operating point.
Step 1: Evaporation from the Heat Load
The heat the circulating water gives up equals flow × specific heat × temperature difference. If you assume all of that heat goes into evaporating water, evaporation equals the heat load divided by the latent heat.
A real tower also transfers sensible heat from the water to the air, so this latent-heat-only formula is a simplification. Use the manufacturer's calculation, which includes air conditions, to determine design flow rates, and check against measured makeup and blowdown during operation.
Latent heat changes with water temperature, so take it from a steam table at conditions that match your calculation. The value at boiling (about 2,257 kJ/kg at 100°C) is lower than the value near typical cooling water temperatures (about 2,430 kJ/kg at 30°C), and using it for a cooling tower shifts the estimate.
If circulating flow is given in m³/h, multiply by the density of water to convert to kg/h.
English-language sources also use rule-of-thumb factors. The table below applies two of them to the same example, alongside the latent-heat-only formula.
| Method | Formula | E for this example |
|---|---|---|
| Latent heat only (this article) | L × cp × ΔT ÷ r | 870.8 kg/h |
| BAC estimate for sizing blowdown | L × ΔT(°C) × 0.0018 | 900 kg/h |
| US rule of thumb | L × ΔT(°F) × 0.00085 | 765 kg/h |
For the same tower, the results range from 765 to 900 kg/h. BAC describes its factor as the maximum evaporation rate, suitable for sizing blowdown but not for estimating annual water consumption, which also depends on climate and capacity control. When you compare a Japanese calculation with a local one, first check which method each side used.
Step 2: Drift from the Circulating Flow
Drift is liquid water carried out of the tower as droplets in the air. Unlike evaporated water, these droplets carry dissolved salts and treatment chemicals with them, so the solids balance treats drift the same way as blowdown.
Figure 3 shows how a drift eliminator separates droplets from the airflow.
Figure 3: Vapor and Droplets Take Dissolved Solids to Different Places
A drift eliminator turns the airflow to capture droplets. It is not designed to return all the water vapor to the basin.
Eliminator shapes vary by model. Damage or poor installation increases drift, so manage the specification and the actual condition together.
Drift rate depends on the tower design, airflow, and eliminator performance. Manufacturer data cite about 0.0005–0.001% of circulating flow or less for towers with high-efficiency eliminators, and 0.1–0.2% for a typical induced-draft tower, so no single rate fits every tower.
To show the method, this example assumes 0.05%. As a fraction, that is 0.0005, so watch the decimal place when you multiply it by the circulating flow.
Step 3: Blowdown from the Target Cycles
At steady state, the makeup coming in equals the total water going out. The dissolved solids coming in also equal the solids going out, so two balances, one for water and one for solids, give you the blowdown rate.
Figure 4 shows the two balances side by side.
Figure 4: Separate Balances for Water and Dissolved Solids
Evaporation E carries none of the non-volatile solids being tracked. Blowdown B and drift W both carry them at circulating concentration C.
This balance excludes gains or losses from leaks, precipitation, corrosion, and chemical dosing. C and C₀ are the amount of the substance per unit mass of water, to match the mass flow rates.
Combining the two balances shows that evaporation equals (N − 1) times the total liquid outflow. Solving for B gives the required blowdown:
Many English sources write the simpler form B = E / (N − 1). That form treats drift as negligible, or counts it as part of "blowdown." When drift is significant, subtract it as shown above, and check which form a Japanese or local calculation uses before comparing their numbers.
Step 4: Makeup Water
Makeup is the sum of evaporation, drift, and blowdown. Substituting B cancels out W, so for a given evaporation rate and target cycles, makeup depends only on N.
W dropping out of the equation does not mean drift can be ignored. More drift reduces the controlled blowdown you need, but it also releases more droplets into the surroundings, and at some point the target cycles can no longer be held.
If the formula gives a negative B, drift and other liquid losses alone already exceed the required outflow. Blowdown cannot be negative, so set B to zero and recalculate the cycles the system will actually reach.
How Much Water Higher Cycles Save
At the same heat load, raising N does not reduce the water needed for evaporation. What you mainly cut is blowdown, and each further increase in N saves less than the one before.
Figure 5 holds evaporation and drift constant and changes only N.
Figure 5: Cycles of Concentration vs. Water Required
Calculated with E = 870.833… kg/h and W = 50 kg/h held constant. Doubling cycles does not halve makeup.
| Cycles N | Blowdown B, kg/h (gpm) | Makeup M, kg/h (gpm) |
|---|---|---|
| 2 | 820.8 (3.6) | 1,741.7 (7.7) |
| 3 | 385.4 (1.7) | 1,306.3 (5.8) |
| 5 | 167.7 (0.74) | 1,088.5 (4.8) |
| 6 | 124.2 (0.55) | 1,045.0 (4.6) |
Going from 3 to 6 cycles cuts makeup by 20%. Blowdown B, excluding drift, drops by about 67.8% under these conditions. The allowable cycles must still be set from water quality.
In this example, going from 3 to 6 cycles reduces makeup by 261.25 kg/h. For the annual saving, multiply that difference by the actual operating hours, then weigh it against any added pretreatment and maintenance cost. The DOE gives the same 20% makeup reduction for a change from three to six cycles.
Checking the Numbers Against Operating Data
On a real system, read the makeup and blowdown totalizers over the same period, and record the conductivity of both circulating and makeup water. Avoid startup and periods right after a large makeup addition. Comparing stable periods makes it easier to find the cause of any mismatch.
When you calculate cycles from water volumes and drift is not negligible, divide makeup by B + W rather than by B alone. If the concentration ratio and the volume ratio disagree, check for leaks, overflow, flowmeter readings, and sampling conditions, in that order.
A typical setup opens and closes the blowdown valve on conductivity and drives the makeup valve on basin level. Keep those two control loops separate in your records.
It also helps to log the analog measurement signals (for example, 4–20 mA conductivity) separately from the digital input/output (DI/DO) signals for valve operation and status.
Even with healthy instruments, a clogged or leaking blowdown valve will not deliver the set flow. Combine scheduled inspection with trend monitoring of the operating data.
Cycles of concentration is useful beyond design calculations. Compared over periods with similar heat load and water quality, makeup, blowdown, and chemical use become a routine check on the plant's water and energy management.
Checklist: Reviewing a Japanese Cooling Water Specification
Use this list when a Japanese chiller, cooling tower, or specification sheet gives cycles, blowdown, or water quality limits.
- Which water quality standard the limits come from (JRA GL-02-1994, the tower maker's own table, or a project specification)
- Which column applies: recirculating cooling water, closed-circuit spray water, or closed-loop water
- Conductivity units (mS/m vs. µS/cm) and the measurement temperature (JRA values are at 25°C)
- Whether the makeup source matches the guideline's assumption (tap, industrial, or groundwater), or is softened, RO, or reclaimed water
- Makeup water analysis for every parameter in the table, not just conductivity
- Which parameter limits the target cycles, and by how much
- Materials of the heat exchanger tubes and tower components that the limits are meant to protect
- Evaporation method and latent heat value used in the blowdown calculation
- Drift rate: specified value from the tower datasheet, or an assumption
- Whether blowdown figures include or exclude drift
- Control method: conductivity setpoint for blowdown, level control for makeup, and where the meters are
- Whether running at higher cycles than the Japanese specification affects the equipment warranty
Questions to Ask the Japanese Supplier
These questions are written so you can paste them into an email or a technical query sheet.
- Your manual specifies JRA GL-02. Which items are mandatory for the warranty, and which are reference items?
- Our makeup water analysis is attached. What target cycles of concentration do you recommend for this water?
- We plan to use a water treatment program with scale and corrosion inhibitors. Can the circulating water exceed the JRA limits under this program? If so, which items and by how much?
- Our makeup water is softened (or RO-treated). What limits apply, given that JRA GL-02 excludes softened water?
- What evaporation rate, drift rate, and latent heat did you use in your blowdown calculation?
- Please confirm the conductivity limit in µS/cm and the reference temperature.
Limits of This Guide
- The calculation example uses assumed values to show the method. It is not a design basis for any tower.
- The JRA values are taken from published reproductions of the guideline table, not from the purchased standard itself. Confirm against the current JRAIA document and the equipment manual.
- BAC's limits are one manufacturer's guidelines for specific materials. Other manufacturers and water treatment programs set different values.
- Scale and corrosion depend on pH, alkalinity, temperature, and treatment chemistry. A cycles calculation alone does not predict them.
- Concentration control alone does not prevent slime or other biological fouling. That also needs cleaning and an appropriate treatment program, because growth depends on suspended matter, nutrients, temperature, and stagnant areas. Biological control, including Legionella management, is outside the scope of this guide.
- Whether a site can run above the Japanese limits is a decision for the equipment owner, the water treatment company, and the equipment supplier, especially where warranties apply.
FAQ
What Cycles of Concentration Should a Cooling Tower Run At?
There is no universal value. It depends on the makeup water analysis and the limits for the connected equipment.
The DOE notes that many systems run at two to four cycles and that six or more may be possible. Start from the design value and revisit it when the water source, load, materials, or treatment program changes.
What Is the Formula for Cooling Tower Blowdown?
Blowdown B = E / (N − 1) − W, where E is evaporation, N is cycles of concentration, and W is drift. Makeup M = E + B + W, which simplifies to NE / (N − 1). If drift is negligible, the common shortcut B = E / (N − 1) gives nearly the same result.
Can I Calculate Cycles from Conductivity?
Yes, as a day-to-day indicator. Divide circulating water conductivity by makeup water conductivity, measured at the same temperature or with the same temperature compensation. Chemical dosing also adds conductivity, so confirm the ratio against periodic chemical analysis.
What Happens If You Blow Down Too Much?
Concentration stays low, but makeup and wastewater both increase, and treatment chemicals go down the drain with the blowdown. To avoid excess discharge while meeting water quality limits, check the valve setting against the actual measured flow.
Is Makeup Flow the Same as Circulating Flow?
No. Circulating water is reused inside the system, while makeup water only replaces what the system loses. Size piping and pumps on the circulating flow, and size the water supply and makeup equipment on the required makeup flow and operating conditions.
Sources
- Cycles of concentration, makeup and blowdown metering, conductivity control, two-to-four cycles, 20% makeup reduction: US DOE FEMP, "Best Management Practice #10: Cooling Tower Management"
- Water balance, dissolved solids, water treatment: US DOE, "Cooling Towers: Understanding Key Components and How to Improve Water Efficiency"
- Side-stream filtration: US DOE FEMP, "Water-Efficient Technology Opportunity: Side Stream Filtration for Cooling Towers"
- JRA GL-02-1994 circulating and makeup water table, with notes on closed-circuit towers and source water: Technical note "Industrial Water," get-c.co.jp (Japanese); Ministry of the Environment, Japan, "Proper Water Quality Control of Cooling Water" (Japanese)
- JRA GL-02E English edition: JRAIA, Standards
- BAC circulating water guidelines, makeup hardness, B = E / (N − 1), evaporation estimates: Baltimore Aircoil Company, Application Guidelines, Chapter 19
- Drift rates and the 0.00085 evaporation factor: Delta Cooling Towers, "How Do You Calculate Water Loss in a Cooling Tower?"
- Drift and impurities in drift water: SPX Cooling Technologies, "Cooling Tower Performance: Drift" (TR-024)
- Latent heat of vaporization of water (2,429.8 kJ/kg at 30°C; 2,256.4 kJ/kg at 100°C): Engineering ToolBox, "Water: Heat of Vaporization vs. Temperature"
- Water quality data from a Japanese tower manufacturer: Kuken Kogyo, cooling tower water quality control (Japanese)
- Softeners removing hardness by ion exchange: Muromachi Chemical, "Pure Water Systems, Ultrapure Water Systems, and Water Softeners" (Japanese)
Original article in JapaneseThis guide is adapted from a MONOSCOPE article written for readers in Japan: 冷却塔の濃縮倍数とは?決め方とブロー・補給水量の計算方法
About the editor
 MONOSCOPE EditorFOUNDER & EDITOR
Spent about ten years at a plant equipment maker and a plant engineering company, proposing, designing, and commissioning equipment, then moved into web marketing. Now a web consultant for B2B manufacturers, helping them explain their products and technology. Licensed in Japan as an Energy Manager and a Third-Class Chief Electrical Engineer.
Has run an engineering blog since 2017 (500+ articles) and a Japanese YouTube channel with about 20,000 subscribers. Each English guide is written from the Japanese shop-floor point of view and checked against the cited standards.