Electricity Intensity: Calculation, Fixed Load and Tracking

Your plant in Ohio, Pune, or Rayong gets a new request from the head office in Japan: report your electricity gen-tan-i (原単位) every month. The spreadsheet template asks for kWh per unit or kWh per ton, with no explanation of what goes in the numerator or the denominator.
The short answer: electricity intensity is the electricity used in a period divided by the output produced in that same period, inside the same boundary. It shows how many kWh each part or ton took, so you can compare months with different volumes and judge whether an improvement worked.
The catch is that the number can drop for reasons that have nothing to do with saving energy. If volume goes up, the standby load is spread over more parts and kWh per unit falls even when no equipment changed. This guide shows how to set the boundary and denominator, separate fixed load from production load, and tell a real improvement from a volume effect.
Contents
- What Is Electricity Intensity (Gen-tan-i)?
- Why Your Japanese Head Office Asks for It
- How to Calculate It: Boundary, Period, and Denominator
- Splitting Fixed Load from Production Load
- Spotting an Improvement That Is Only Volume
- Ways to Improve It and How Each Shows Up in the Numbers
- Before-and-After Comparison Checklist
- Questions to Ask Your Japanese Head Office
- Where This Guide Does Not Apply
- FAQ
- Sources
What Is Electricity Intensity (Gen-tan-i)?
In Japanese plants, gen-tan-i means the amount of a resource used per unit of output. Denryoku gen-tan-i (電力原単位) is the electricity version, which English sources call electricity intensity or specific energy consumption (SEC). It is written as kWh/unit, kWh/t, or a similar ratio, and a lower value means less electricity per unit of output under that definition.
The numerator is energy in kWh, not power in kW. When the load is constant, power multiplied by operating hours gives energy. When the load varies, integrate readings over time or take the difference between two energy-meter readings instead of relying on a single spot value.
The two formulas below are all you need for the basic calculation.
Keep kWh, kW, Cost, and CO2 as Separate Numbers
Your electricity bill also depends on peak demand in kW (saidai juyo denryoku, maximum demand) and on the unit price. Intensity can stay flat while the bill rises because the tariff went up. Track kWh per unit, cost per unit, and peak kW as three separate items.
Also keep electricity-only intensity apart from energy intensity (enerugi shohi gen-tan-i), which includes fuel and heat. Electrifying a process can raise electricity use while cutting fuel use, so look at total energy before calling the change a gain or a loss.
If you make the same product to the same quality under the same conditions, reducing electricity intensity helps hold down electricity use and cost. CO2 is a different matter. Emissions depend on the emission factor of the electricity you buy and on how the reporting scheme treats it, so do not judge CO2 from intensity alone.
Why Your Japanese Head Office Asks for It
Japanese manufacturers watch intensity closely, partly because the law asks them to. Under Japan's energy conservation law, now called the Act on Rationalizing Energy Use and Shifting to Non-fossil Energy, companies that use 1,500 kL or more of crude-oil-equivalent energy per year in Japan must report every year.
The government asks these designated companies to work toward cutting their energy consumption intensity by an average of 1% or more per year over the medium to long term. It is a benchmark they are asked to aim for, not a legal limit on any single year's figure.
That legal figure covers all energy, not just electricity, and the law applies to energy use in Japan, so an overseas plant's electricity figure is not normally part of that report. A head office may ask overseas plants for the same kind of number for group targets, sustainability reports, or ISO 50001 reviews. Ask which one your figure feeds, because the purpose decides the boundary and the denominator.
If your plant runs an ISO 50001 energy management system, you already know the idea under different names. The table maps the shop-floor Japanese terms to the closest ISO 50001 and ISO 50006 concepts. Treat it as a guide to vocabulary, not a statement that the definitions are identical.
| Japanese term | What it means on the floor | Closest ISO 50001 / ISO 50006 concept |
|---|---|---|
| Gen-tan-i | Energy or electricity per unit of output | An energy performance indicator (EnPI) in ratio form |
| Kijun kikan | The period you compare against | Energy baseline (EnB) and baseline period |
| Hosei | Adjusting for volume, product mix, or weather | Normalization using relevant variables |
| Han-i | Which meters and which output are included | EnPI boundary |
| Setsubi no zosetsu (equipment additions) and similar changes | New lines, in-sourced processes, closed areas | Static factors; a change may require a baseline adjustment |
ISO 50001 guidance describes three common forms of EnPI: a single measured value, a ratio, or a numerical model (for example, one built with regression). A plain ratio such as kWh/unit is the easiest to report but the easiest to misread. The rest of this guide explains why.
India's Perform, Achieve and Trade (PAT) scheme run by the Bureau of Energy Efficiency uses the same idea under the name specific energy consumption. If your Indian site is a designated consumer, check that the plant-level SEC and the head-office gen-tan-i use the same boundary, or explain the difference in your report.
How to Calculate It: Boundary, Period, and Denominator
First decide which electricity goes with which output. To evaluate the whole plant, account for everything the plant receives and generates. To evaluate one process, meter that process.
If you divide whole-plant kWh by the output of a single line, changes in other lines and in the office end up in the number. Match the metering boundary of the numerator to the activity boundary of the denominator. Write the definition down so the next person in your job can reproduce it.
Figure 1 shows the boundary for tracking an improvement on Line A only.
Figure 1: Put Electricity and Output Inside the Same Boundary
Metering boundary for tracking Line A alone. This is not a single-line diagram.
If shared equipment is included, define how its electricity is allocated. Do not add the main meter and submeter readings together, or you will count the same kWh twice.
Align the period, too. If the month closes at a different hour for the meter readings than for production records, night-shift output and lots that cross month-end land in the wrong month. Use the same cutoff time for shift reports, meter readings, and production results before you calculate.
Choose between input quantity and good parts based on what you want to evaluate. Good parts as the denominator captures the electricity wasted on scrap and rework. If you change the denominator partway through, restate past values on the new basis so the trend stays comparable.
For the data itself, use differences between cumulative energy-meter readings, or time-series data collected from power meters. Retrofitting older equipment for data collection is one way to get there.
Decide in advance how you will handle communication gaps and meter replacements.
A Worked Example
Suppose that in one month a line used 12,000 kWh and produced 6,000 good parts inside the same boundary. These are fictional figures for illustration. In a real report, state the definition of a good part and whether shared equipment is included.
Averaging Over Several Months: Use a Weighted Average
To get a yearly figure, do not take a simple average of the monthly intensities. Divide total kWh for the year by total output for the year. A simple average gives a low-volume month the same weight as a high-volume month, so it no longer matches the actual electricity per unit for the year.
Here is a two-month example:
- Month 1: 4,000 kWh for 1,000 units = 4.0 kWh/unit
- Month 2: 6,000 kWh for 2,000 units = 3.0 kWh/unit
- Combined: 10,000 kWh for 3,000 units = about 3.33 kWh/unit
- Simple average of 4.0 and 3.0 = 3.5 kWh/unit, which overstates the two-month figure
When a lot runs across two months, completed output and the electricity it consumed can fall in different months. Record production progress and work in process. When you read short-period values, check how much of each lot's work falls inside the period.
Keep product mix, operating hours, outdoor temperature, and defect rate in the same table as the kWh and output. Treat this as part of your plant KPI tracking, so that when the number gets worse you can trace the cause.
Splitting Fixed Load from Production Load
Split your electricity use into three parts: a proportional part that follows output, a fixed part, and a mixed part in between. This makes it easier to see where to improve. The split is an analytical view, not a permanent label you attach to each machine.
When you classify loads, compare periods with the same operating conditions. Keep two questions apart: how monthly kWh changes with output, and how instantaneous kW changes with load. Confirm both relationships from measured data.
Proportional Load
The proportional part rises as output rises. If each part takes roughly the same work, for example the same material machined under the same conditions, you can approximate kWh as proportional to part count within that range.
That does not mean running the line faster always keeps the relationship proportional. A speed change can alter idle time, efficiency, and yield. Check the processing conditions per part and the operating state before you interpret the relationship.
Fixed Load (Baseload)
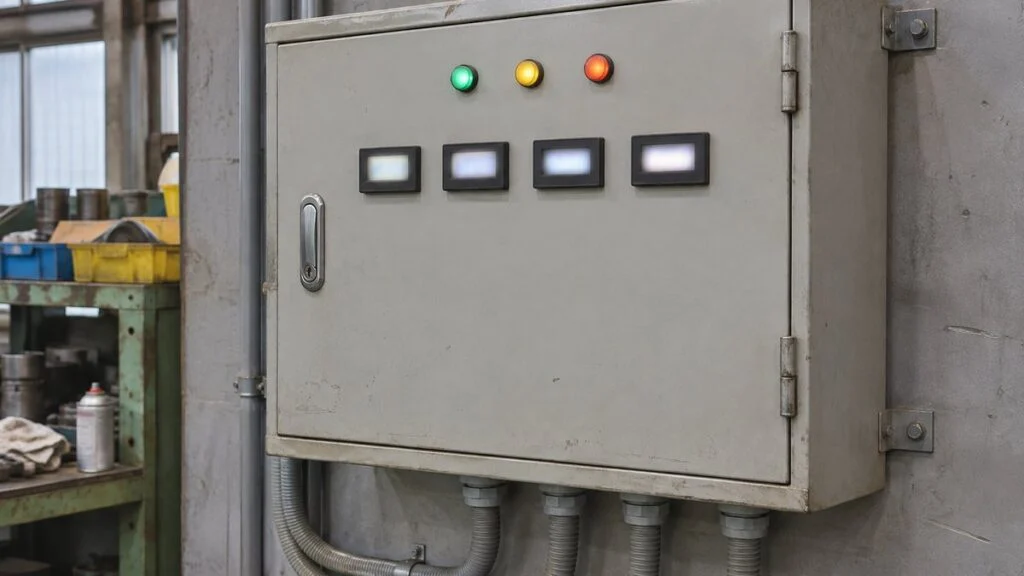
The fixed part is consumption that, for the same period and conditions, depends little on output. Examples include control panels on standby and auxiliary equipment that keeps running when production stops. Measuring during hours with zero production is a good way to find it.
Lighting and HVAC are also loads that do not track output directly. They are not constant, though. Lighting changes with hours on and dimming, and HVAC changes with outdoor temperature, setpoints, and occupancy.
Figure 2 shows what can still draw power while the line is down.
Figure 2: Find the Load That Remains When Production Stops
A standby period showing some of the loads. This is not an instruction to shut everything down.
First identify loads needed for safety, quality, or freeze protection. Then reduce the standby and lighting that serve no purpose.
Fixed load weighs more heavily on each part in low-volume months. If you plan a lighting upgrade, evaluate the LED retrofit separately from any change in operating hours, and measure the effect in actual kWh.
Mixed Load
The mixed part combines fixed and variable consumption. An air compressor uses power to make air, but it also uses power while unloaded (running without delivering air) and while supplying leaks. Its consumption often does not scale simply with part count.
Pumps behave the same way. Their consumption depends on required flow, head, number of units running, speed, and how far the valves are throttled.
Take pump efficiency into account, and look at what the equipment actually delivered and how it ran, not just at the part count.
Figure 3 shows how a shared utility splits between production use and losses.
Figure 3: Separate Non-Production Use in Shared Utilities
Concept of a compressor and its branches. This is not a measured map of air leaks.
Evaluate supply pressure, number of units running, load/unload time, and leak volume together. Do not mistake a leak for higher production demand.
On equipment with a variable frequency drive (VFD), changing how it runs at low load can help. Match the approach to the load type and to the flow and pressure you actually need.
Spotting an Improvement That Is Only Volume
This is the trap to watch for in monthly reports. The fictional example below assumes a fixed load b that stays the same each month and a proportional load a per unit that never changes.
Figure 4: Intensity Falls from Higher Volume Alone (Fictional Example)
Monthly fixed load b and proportional load per unit a are the same in both months.
| Item | Month A | Month B |
|---|---|---|
| Output Q | 1,000 units | 2,000 units |
| Proportional load aQ | 2,000 kWh | 4,000 kWh |
| Fixed load b | 2,000 kWh | 2,000 kWh |
| Total E | 4,000 kWh | 6,000 kWh |
| Intensity I | 4.0 kWh/unit | 3.0 kWh/unit |
Intensity falls 25%, but total electricity rises 50%. These are not measured values and not a guaranteed saving.
The same result written as a simple model:
Nothing got more efficient in this example, and standby consumption did not change. Higher volume spread the fixed load over more parts, and only the intensity went down. To judge an improvement, you have to compare under the same production conditions.
With real data, start with a scatter plot of kWh against output. If product type or weather has a large effect, split the data into groups or use a model with several variables. This separates changes in operating conditions from real improvement, which is the same idea ISO 50006 calls normalization.
Now suppose that after an improvement the line again made 2,000 units. The baseline model, assuming the same conditions, predicts 6,000 kWh. If the meter shows 5,400 kWh, the gap against the model is 600 kWh.
Even then, check whether product mix or the metering boundary changed between the baseline period and the period after the improvement. If the gap is small compared with the model's scatter or the meter's error, do not declare a result from a few weeks of data. Keep collecting.
Watch for changes in what the plant does. Adding equipment or bringing an outsourced process in-house changes the work behind the number. Record the date of any boundary change and revise the baseline, so the plant does not inherit a target that no longer fits reality.
Ways to Improve It and How Each Shows Up in the Numbers
Set priorities by starting with the processes that use the most electricity and the loads that stay on during downtime. Set the baseline and the measurement method before you act. Afterward, compare at the same output and quality so the result can guide the next step.
Operating Practices
Look at cutting unnecessary standby time, the startup sequence, batching production, and running only as many units as the load needs. Separate the heating and ventilation needed for safety functions or quality from the rest. Be clear about what can be switched off and what must stay on.
Staggering equipment that runs at the same time lowers peak demand. If the same consumption simply moves to another hour, though, total kWh for the period does not fall. Judge intensity by cumulative kWh.
Figure 5 shows two schedules with the same energy but different peaks.
Figure 5: A Lower Peak Is Not Lower Energy
Simplified constant loads. Both cases use 200 kWh over 4 hours.
At the same output, the electricity intensity is also the same in both cases. In practice, longer operating hours can add auxiliary and HVAC consumption, so include that too.
If you are after both demand reduction and energy savings, record the load you shifted in time separately from the energy you actually eliminated. Putting peak kW next to intensity in the same report helps avoid confusing the two effects.
Monitoring and Follow-Up
Collecting data does not save anything by itself. Decide who looks at which values, how often, over what boundary, and which changes they investigate. When something looks wrong, check it against operating logs and equipment condition.
For example, a day with a long warm-up or a lot of rework uses more electricity for the same part count. When you analyze the data, confirm missing values and outliers against the records instead of keeping only the data that suits you.
When you train the team, share more than the intensity target. Cover which equipment can be stopped, the restart steps it needs, and how to record what was done, all under your site's own safety and lockout procedures. That way the floor can tell a change caused by higher volume from a result of cutting wasted run time.
Process Efficiency
Here you look for ways to do the necessary work with less input. Equipment replacement is one option. Others include reducing leaks, fixing friction and clogging, and setting temperature, pressure, and flow to what the process actually needs.
Automation can improve intensity by reducing stoppages and defects, but it also adds drives and standby loads. Do not just compare the rated power of individual machines. Judge the effect by the electricity the whole sequence of processes needs to make a good part.
Before investing, list the run time and load you expect to cut and the annual operating conditions. Afterward, measure again inside the same boundary. Record changes in total kWh, quality, capacity, and maintenance workload, not just intensity.
Process Change
Changing the process itself can mean a different heating or processing method, or combining process steps. Because the number of steps and the processing conditions change, compare the whole picture: electricity, fuel, water, and yield.
Switching to renewable electricity changes how you source power and how CO2 is counted. If the same equipment uses the same kWh to make the same number of parts, changing the supplier does not change an intensity defined on consumed kWh.
On-site generation that cuts purchased electricity also needs care. If only purchased kWh goes in the numerator, more on-site generation looks like an efficiency gain. State clearly which electricity flows the indicator includes.
Before-and-After Comparison Checklist
Before you present a before-and-after difference as the effect of an improvement, confirm the conditions below match. In a lower-volume month, fixed load weighs more on each part, so a comparison under different conditions can hide a real improvement or invent one.
| Item | Why it matters | Example entry |
|---|---|---|
| Comparison period | HVAC and lighting use change with the season | Before: October last year. After: October this year |
| How output is counted | Intensity changes with units, weight, or sales value | Shipped weight of good parts (metric tons), both periods |
| Product mix | Each product uses a different amount of electricity | Share of large parts fell from 40% to 20% |
| Operating days and hours | Standby and startup energy gets mixed in | 20 operating days, two shifts, both periods |
| Metering boundary | Unrelated equipment hides the difference | Plant 2 incoming supply point only; office building excluded |
| Equipment added or stopped | Separates changes not caused by the improvement | One drying oven added in August |
For the monthly report itself, run through this shorter list:
- kWh (energy) and kW (demand) are kept apart, and the numerator and denominator cover the same period and boundary
- Output, product mix, yield, and operating hours are recorded with the kWh
- Any allocation of fixed load is kept separate from actual energy savings
- Peak reduction, cost reduction, and CO2 reduction are reported as separate items
- Multi-month figures use total kWh divided by total output, not an average of monthly ratios
- Safety and quality functions are kept running, and results after a change are measured inside the same boundary
Questions to Ask Your Japanese Head Office
Undocumented definitions make gen-tan-i figures hard to compare. Ask these questions before you send the first report:
- What is the figure used for: a group target, a sustainability report, ISO 50001, or an internal KPI?
- Is it electricity only, or all energy including fuel? If all energy, what conversion factors should we use?
- Which meters are in the numerator: the main incoming meter, purchased electricity only, or consumption including on-site generation?
- What is the denominator: input quantity, good parts, shipped weight, or another measure? Units or metric tons?
- What are the month-end cutoff date and time for both meter readings and production records?
- Are the office, warehouse, and shared utilities included? If shared, how should they be allocated?
- How should we report months or days with zero production?
- How are yearly figures calculated, and is there a baseline year?
- Do you want product mix, operating hours, or outdoor temperature reported alongside, for normalization?
- Is there a reduction target for our plant, and how is it defined?
If you prefer to send this as an email, you can adapt the template below.
Subject: Definition of monthly electricity intensity (gen-tan-i) for [plant name]
Hello [name],
Thank you for the new monthly electricity intensity template. Before we send our first report, we would like to confirm the definition so our numbers match the rest of the group.
1. Numerator: should we use the main incoming meter, purchased electricity only, or total consumption including on-site generation?
2. Denominator: good parts, input quantity, or shipped weight (metric tons)?
3. Boundary: are the office, warehouse, and compressed-air system included?
4. Period: what cutoff date and time should we use for meter readings and production data?
5. Yearly figure: total kWh divided by total output, or another method?We can also report product mix and operating hours each month if that helps your analysis.
Best regards,
[your name]
Where This Guide Does Not Apply
The models in this guide are simplified to show the logic. Real plants have several products, weather effects, and loads that switch between fixed and variable behavior, so a single straight line may not fit. If your data does not fit a simple model, ask the person who owns the energy management system which normalization method the group uses.
Definitions also vary by company and industry. Groups may report per ton, per unit, or per sales value, while legal reporting in Japan uses all energy converted to crude-oil equivalent. Follow your head office's definition, and where it conflicts with a local scheme such as India's PAT, document both.
This guide does not cover CO2 accounting. Emission factors, renewable certificates, and market-based versus location-based reporting follow their own rules. Confirm them with your sustainability team.
FAQ
If Electricity Intensity Goes Down, Did Total kWh Go Down Too?
Not necessarily. Intensity is a per-unit value, so it can fall while total kWh rises when output increases. Look at both numbers and judge improvement by comparing under the same production conditions.
How Do I Calculate a Yearly Electricity Intensity from Monthly Values?
Divide total kWh for the year by total output for the year. A simple average of monthly ratios gives low-volume months too much weight. In the example above, the weighted figure is about 3.33 kWh/unit, while the simple average is 3.5.
What Do I Report for a Day with Zero Production?
You cannot calculate kWh/unit when the denominator is zero. Do not show the intensity as zero. Mark it as not applicable and record the electricity used during the shutdown separately, because that data shows you the standby load.
Can I Compare Months with Different Product Mixes?
Yes, but only if you account for the mix. If products use different amounts of electricity, a simple comparison mixes in the change in product mix. Split the data by product, use a suitable equivalent-output measure, or correct with a model that includes the conditions, and define which method you use.
Does Peak Shifting Improve Electricity Intensity?
No. Moving the same kWh to another time leaves intensity unchanged at the same output, so check the real energy effect with total kWh, including any extra auxiliary load from longer run times. Report contract demand and cost effects separately.
Sources
- kW vs. kWh: Central Research Institute of Electric Power Industry (CRIEPI), column on kW and kWh (Japanese)
- Factors that change intensity: Keyence, energy-saving measures guide (Japanese)
- Analyzing energy use and cost: U.S. Department of Energy, eGuide for ISO 50001
- Intensity vs. regression models: Oak Ridge National Laboratory, "Quantifying the Statistical Importance of Utilizing Regression over Classic Energy Intensity"
- Compressed air leaks and load control: U.S. Department of Energy, "Improving Compressed Air System Performance," 3rd edition
- Demand and electricity charges: Osaki Electric, demand and electricity rates (Japanese)
- Electricity supply contracts and emissions: Ministry of the Environment, Japan, Q&A on electricity supply contracts (Japanese)
- Name of Japan's energy conservation law (2023 amendment): METI press release, March 31, 2023
- 1% annual energy intensity reduction: IEA, "Revised Energy Conservation Act (2008)"; SMRJ J-Net21, energy conservation law Q&A (Japanese)
- EnPI forms, baselines, and normalization: Lawrence Berkeley National Laboratory, 50001 Ready Navigator, Task 11; ISO 50006:2023 catalog entry
- India's PAT scheme and specific energy consumption: IEA, "Perform, Achieve, Trade (PAT) Scheme"
Original article in JapaneseThis guide is adapted from a MONOSCOPE article written for readers in Japan: 電力原単位とは?計算方法・固定電力と改善効果の見方
About the editor
 MONOSCOPE EditorFOUNDER & EDITOR
Spent about ten years at a plant equipment maker and a plant engineering company, proposing, designing, and commissioning equipment, then moved into web marketing. Now a web consultant for B2B manufacturers, helping them explain their products and technology. Licensed in Japan as an Energy Manager and a Third-Class Chief Electrical Engineer.
Has run an engineering blog since 2017 (500+ articles) and a Japanese YouTube channel with about 20,000 subscribers. Each English guide is written from the Japanese shop-floor point of view and checked against the cited standards.