How to Reduce Manufacturing Lead Time: 5 Areas to Target
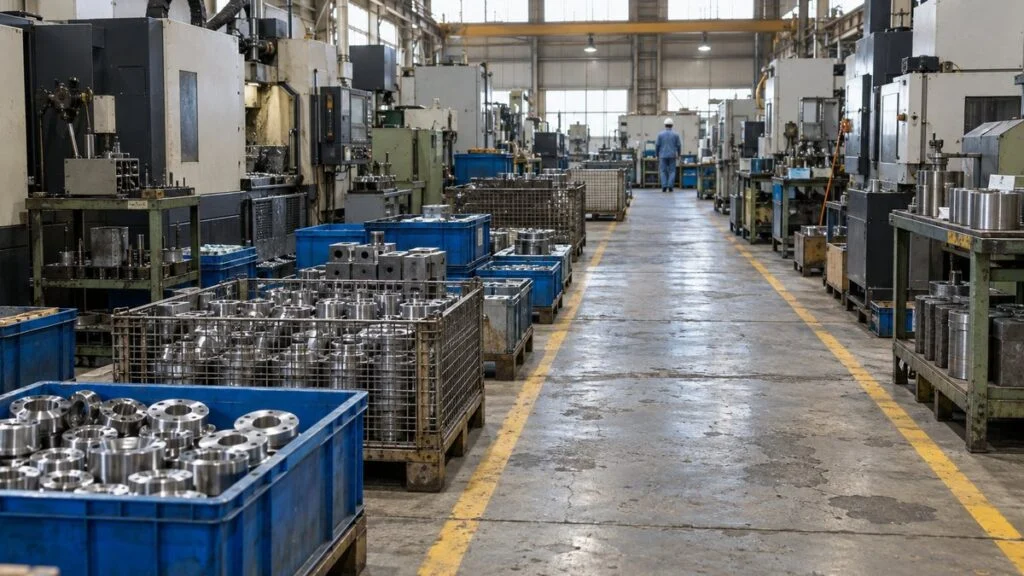
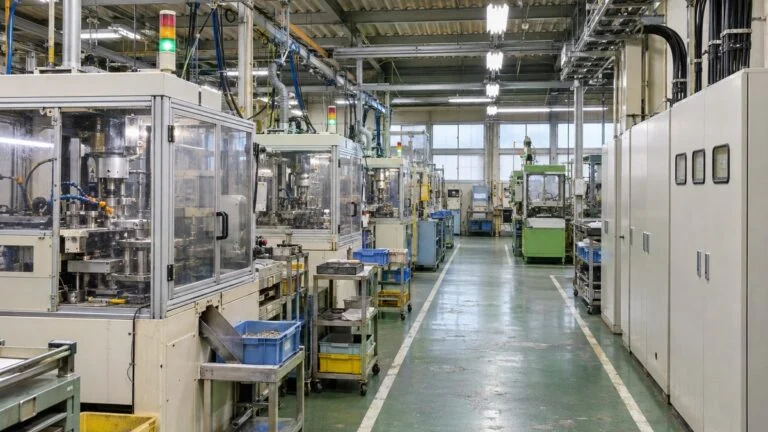
Follow one lot of parts through a factory, from the moment material is released to the floor until the finished goods reach the warehouse. In many plants, the parts spend far more time waiting in front of processes than being worked on by machines. That whole span is the manufacturing lead time.
Speeding up processing alone barely changes the completion date if the waiting time stays the same. The starting point for reducing lead time is to measure its components: where the parts wait, before which process, and for how long.
This guide works through lead time reduction in three steps: decide what to measure, measure the components, and pick fixes that match the cause of the waiting. It also covers the Japanese shop-floor terms you will meet when you work with Japanese plants, suppliers, or a Japanese parent company, and ends with a checklist and a list of questions you can use right away.
Contents
- What Is Manufacturing Lead Time? Define the Start and End Points First
- Manufacturing Lead Time Components: Processing (Including Setup), Transportation, Inspection, and Waiting
- Why Lead Time Gets Long: From Shop-Floor Symptoms to Causes
- How to Measure Manufacturing Lead Time
- How to Reduce Manufacturing Lead Time: Five Areas of Improvement
- Where to Start: Choosing the Target and the First Fix
- What to Check After a Change
- Japanese Shop-Floor Terms: Quick Reference
- Lead Time Reduction Checklist
- Questions to Ask a Japanese Supplier or Plant
- Limits of This Guide
- Summary
- FAQ
- Sources
What Is Manufacturing Lead Time? Define the Start and End Points First

JIS Z 8141, the Japanese Industrial Standard for production management terms, defines lead time two ways. One is the time from placing an order to receiving delivery, which is procurement time seen from the buyer's side. The other is the time from when material is ready until it becomes a finished product, which is production time seen from the maker's side.
The same standard also defines production lead time (seisan lead time) as "the period from the start of production to its completion." In practice, manufacturing lead time and production lead time mean almost the same thing.
When someone on the floor says "our lead time is too long," however, different people often mean different spans. Sales may be thinking of order-to-delivery, while production is thinking of first operation to final inspection. Before you try to shorten anything, agree on exactly where the clock starts and stops.
Figure 1 shows where manufacturing lead time sits within the total time a customer waits.
Manufacturing lead time is the part of the customer's wait that happens inside the plant, from the start of production to completion.
In make-to-order production that starts with design, design time comes before all of this.
There is no single correct start and end point. One workable choice is to start when material is issued to the floor and stop when the lot passes final inspection and goes into finished-goods stock. Some companies also include storage in the raw-material warehouse, or the wait for shipment after completion.
Also decide whether to count calendar days (including holidays) or working days only, because the same lot gives different numbers. A common split is calendar days for quoting delivery dates to customers, and working days or working hours for tracking improvement inside the plant.
The span you measure also connects to the buyer's lead time. The Japan Institute of Industrial Engineering (JIIE) notes that in make-to-order production, production lead time can be seen as part of the buyer's procurement lead time. Shortening production lead time therefore directly shortens procurement lead time for your customer.
Manufacturing Lead Time Components: Processing (Including Setup), Transportation, Inspection, and Waiting
Once the span is defined, break it into parts. Process analysis (kotei bunseki), which charts how material flows through a plant, sorts every step into four categories: processing, transportation, inspection, and waiting. JIS Z 8141 uses the same four categories for process chart symbols.
If you are used to US references, the categories map closely to terms you already know. The ASME flow process chart uses five symbols, splitting the Japanese "waiting" category into delay and storage. ERP documentation, such as Oracle's for JD Edwards, breaks manufacturing lead time into elements that include queue, setup, run, move, and inspection time.
| Japanese category (JIS) | Romaji | Closest English terms |
|---|---|---|
| Processing | kako | Run time; setup (changeover) time is tracked here too |
| Transportation | unpan | Move time |
| Inspection | kensa | Inspection time |
| Waiting (stagnation) | teitai | Queue time, wait time; delay and storage in ASME flow process charts |
Each category answers a different question about where the time goes, as Figure 2 shows.
Each category covers a different kind of time and calls for different checks.
Processing and Setup
Processing is the time spent changing the shape or properties of the material to bring it closer to the finished product. Of the four categories, it is the one that changes the product itself.
Setup comes with processing. Japanese plants call a changeover dandori-gae, and JIS Z 8141 describes setup as preparing materials, machines, jigs and tools, and drawings, plus trial processing, when switching to a different product or process.
The equipment stands idle during a changeover, so the longer it takes, the stronger the pull to "run big batches." That effect comes up again under the causes and fixes below.
Transportation (Move)
Transportation is the time spent moving material from one process to the next. The move itself may be short, but rules such as "move it when the pallet is full" or "run the shuttle twice a day" can create waiting time for transport.
Inspection
Inspection is the time spent checking quantity or quality against a standard and making a pass/fail decision. It is needed to assure quality, so cutting it is not the answer. Look less at the inspection work itself and more at the time spent queuing for inspection or waiting for a judgment.
Waiting (Teitai)
Waiting, or teitai, is time when material sits with nothing being done to it. There are two main types:
- Process waiting (kotei-machi): the lot waits for the previous lot to finish on the machine.
- Lot waiting (rotto-machi): a part that is already finished cannot move to the next process while the other parts in the same lot are still being processed. The bigger the lot, the longer this wait.
Waiting is not recorded as anyone's working time, so it often does not show up in daily reports or job records. Unless you measure it on purpose, you can easily miss how long it is.
Figure 3 shows how the four categories might add up for a single lot.
A lot of parts made in three processes, tracked from material release to receipt into finished-goods stock.
Fictional numbers for illustration (based on 8 working hours per day). The real breakdown depends on the product, the processes, and the span you measure, so measure it in your own plant.
Figure 3 is a fictional example, but the idea that waiting takes up most of the lead time also appears in Japanese trade literature. One example is an article by Haruo Fujii in the January 2022 issue of Kojo Kanri (Factory Management), published by Nikkan Kogyo Shimbun.
The article includes a chart of time shares from process analysis that puts the waiting time of work-in-process (WIP) at about 90–97%, with processing, transportation, and inspection making up the rest. It does not state the survey scope or conditions, so treat the figure as the author's rule of thumb.
The same article says that for a typical manufacturer, manufacturing lead time runs from about two weeks to, in some cases, several months once raw-material storage and the wait for shipment are included. The share depends on the span you measure, but the message is clear: look beyond processing time.
Why Lead Time Gets Long: From Shop-Floor Symptoms to Causes

So where does all that waiting come from? Take a fictional plant that makes parts in three processes: cutting, drilling, and assembly. More and more orders miss the standard delivery time, and rush orders (tokkyu-hin) jumping the queue have become routine.
When a rush order goes first, the regular orders it bumps wait even longer. Those regular orders then get close to their due dates and become the next rush orders. Frequent rush orders are a result of long lead time and, at the same time, one of its causes.
In a plant like this, the likely causes fall into five groups:
- Large lots, which lengthen lot waiting
- Long changeovers, which push the plant toward big batches
- WIP piling up in front of a process that lacks capacity (the bottleneck)
- Waiting for things other than material flow: plans, work orders, or parts
- Defects or equipment stoppages that force rework or schedule changes
JIS Z 8141 defines a bottleneck as a process, piece of equipment, function, or department where the required capacity exceeds the available capacity. The Japanese term is airo, though "bottleneck" is also used. The output of the whole plant is set by the capacity of this process.
Do not decide the cause by appearance alone. A pile of WIP in front of one process, for example, can come from a capacity shortage, from parts waiting until a big enough batch builds up to justify a changeover, or from a missing component. As Figure 4 shows, decide which records to check for each symptom, narrow down the possible causes, and only then choose a fix.
When you see a symptom, check the records first, narrow down the causes, and then choose a fix.
One symptom can have several overlapping causes. If no records exist, start by measuring with the methods in the next section.
How to Measure Manufacturing Lead Time
You cannot pin down the cause without measuring. There are two methods with different purposes: measuring the components process by process, and estimating the overall average with a formula.
Set the Product, Period, and Time Unit
First, choose which products to measure. You do not need to cover every product at once. Pick one or two: a product with late deliveries or frequent rush orders, or a high-volume, representative product.
Confirm the start and end points and the day-counting rule (calendar or working days) set earlier. If these are not consistent, you cannot compare the numbers before and after an improvement.
Track a Lot to Measure the Components
The basic method is to follow one lot from material release to completion and record its processing, transportation, inspection, and waiting time in order. This is process analysis, and it produces a list of how many hours the lot sat before and after each process.
If no one can follow the lot in person, ask operators to write three times on the traveler (genpin-hyo) or daily work report: arrival at the process, start, and finish. Arrival to start is process waiting, and finish to arrival at the next process is lot waiting plus transportation.
Plants that collect production data with barcodes or tablets can get the same figures from their records. A single lot can be distorted by chance, so measure several lots if you can, and look at rush orders and regular orders separately.
Estimate the Average with Little's Law
For a quick estimate of the overall average, use Little's Law. John Little published the proof of this queuing relationship in 1961. In manufacturing terms, it reads: WIP = throughput × lead time, where throughput is the number of units completed per unit of time.
Figure 5 rearranges the formula to estimate average lead time.
Use averages for the same span and the same period.
=
÷
Fictional numbers for illustration. The formula gives only the overall average, not which process the parts wait at. Use averages from a period of stable production.
The formula shows that at a given throughput, WIP and average lead time are proportional. Simply counting WIP, from an inventory count or a walk through the floor, gives you a rough lead time.
The formula does not promise that cutting WIP will shorten lead time automatically. If you restrict material release so much that throughput also falls, lead time will not shrink. Use the estimate to see the big picture, then track lots to find where the waiting happens.
How to Reduce Manufacturing Lead Time: Five Areas of Improvement

There are many individual methods, but grouped by the time they target, they fall into five areas. Once you know where the parts wait and roughly why, choose fixes from the matching area in Figure 6.
Which area to choose depends on which wait you want to cut.
Areas 1–4 cut waiting directly. Area 5 reduces the disruptions that create extra waiting.
Area 1: Shrink Lots and Shorten Changeovers
Smaller lots mean shorter lot waiting. The extreme case is one-piece flow (ikko-nagashi), which JIS Z 8141 describes as sending each piece to the next process as soon as it is processed. Smaller lots, however, mean more changeovers, so if each changeover stays long, the machines will sit idle for more of the day.
That is why changeover reduction comes first. Setup work splits into internal setup (uchi-dandori), done with the machine stopped, and external setup (soto-dandori), done while it runs. JIIE recommends first moving as much internal setup as possible to external setup, then shortening the internal setup that remains.
JIS uses the term shinguru dandori (single setup) for an internal setup that takes less than 10 minutes. English-speaking plants know the same under-10-minute target from SMED (single-minute exchange of die). Plants work toward it with improvements such as these:
- Bring the next die or jig to the machine before the changeover starts
- Make clamping simpler
- Use fixed locating so no adjustment is needed
Sorting and organizing the workplace so no one hunts for tools (seiri and seiton, the first two of the 5S) is the groundwork for all of this.
The Kojo Kanri article cited above gives a worked example. A 1.5-hour changeover done 14 times a month stops the machine for 21 hours a month. Cut it to 9 minutes, and even 42 changeovers a month stop it for only 6.3 hours.
These numbers compare total machine downtime, but tripling the number of changeovers opens the way to cutting lot sizes to a third.
Some equipment, such as heat-treating furnaces and plating tanks, is built to process in batches. Not every process can run small lots, so a practical approach is to treat the batch process as a boundary and run different flow rules on either side of it.
Area 2: Pace Release to the Bottleneck and Cap WIP
As noted above, plant output is set by the capacity of the bottleneck. If upstream processes release material faster than that, output does not rise. Instead, WIP piles up in front of the bottleneck, and by Little's Law, lead time grows by the same proportion.
The fix comes in two stages. First, match material release to the bottleneck's pace. Second, raise the bottleneck's own capacity, for example by keeping it running through lunch breaks, shortening its changeovers, or inspecting upstream so no defective parts reach it.
When the bottleneck is hard to identify, or shifts with the product mix, cap the WIP between processes. Set the limit by the floor space or the number of carts, and stop the upstream process when the space is full.
The pull from the downstream process (ato-kotei hikitori), in which each process makes only what the next process has used, rests on the same idea. On its official website, Toyota describes the aim of the Toyota Production System as thoroughly eliminating waste and shortening lead times.
Another Toyota Production System term you will hear is heijunka (production leveling). JIS Z 8141 describes it as producing so that the workload is evened out and the types and quantities of parts withdrawn from upstream processes are also evened out.
On an assembly line where processes run back to back, evening out the work time at each station cuts process waiting. Line balancing, which redistributes the work among stations, is the practical tool here.
Area 3: Remove Waits for Plans and Information
When the machines and people are free but material still is not moving, information is what has stopped. Typical situations:
- No work order has been issued
- No one has decided what to make next
- Drawings or inspection standards have not arrived
- Material or parts are missing
The basic rule is to confirm that everything needed is ready before releasing a job. A job released with even one part missing stops partway through and takes up floor space as WIP. This also takes coordination with purchasing, such as ordering long-lead materials ahead of time.
Build plans that the equipment can actually meet. A plan that loads a process beyond its capacity cannot be kept from day one, and it leads to resequencing on the floor and more rush orders. To track progress, plants use systems that collect production records, such as a manufacturing execution system (MES).
Area 4: Rethink Transportation and Inspection
For transportation, the two main levers are shorter distances and smaller transfer quantities. Arranging equipment in process order shortens distances and makes it easier to pass parts to the next process one at a time or in small quantities.
For inspection, break the waiting time down by cause: waiting for an inspector, waiting for a free gauge, or waiting for sign-off on the result. Each needs a different fix. When operators check more items themselves within the process, final inspection gets less congested and fewer defects flow downstream.
Area 5: Reduce Rework from Defects and Breakdowns
A defect sends parts back through the same process for rework or remaking. A sudden equipment stop holds up the WIP behind it and forces a new schedule. Rework not only lengthens lead time but also makes it vary, which is the harder problem.
When lead time varies, the plant releases jobs early to protect due dates, which adds even more WIP. If defects or breakdowns turn out to be the main cause, stabilizing quality and equipment is a faster route than changing how work flows.
Where to Start: Choosing the Target and the First Fix
Working on all five areas at once is not realistic. Narrow the target, measure, and attack the biggest waits first, following the steps in Figure 7.
Choose a target and measure it, confirm the cause, and only then test a fix.
Do not stop after one round. Move on to the next-largest wait and repeat.
Narrow down the target product using three criteria: long waiting time, a large impact on customer due dates or inventory, and ease of action within your own department. Start with changes you can test by adjusting a rule. They show results faster than projects that need capital investment, even high-impact ones.
When you look for fixes, the ECRS principle helps: consider Eliminate, Combine, Rearrange, and Simplify, in that order. For waiting and transportation, the principle reminds you to ask "Can we remove this?" before asking "Can we shorten it?"
In the fictional plant above, you would pick one product family with many rush orders and measure the waiting before and after each of the three processes. If the longest wait is in front of drilling and the reason is parts waiting for a batch to build up so changeovers happen less often, start with changeover reduction in Area 1.
The production department rarely solves lead time on its own, and who you need to involve depends on the cause. Figure 8 lists, for each type of wait, what to check and which department to involve.
The departments you work with change with the cause of the wait.
Department names and roles differ between companies and plants.
With smaller lots, one person more often has to cover several processes or machines. To build up the number of people who can step in, a skills matrix that shows who can do which job is useful.
What to Check After a Change

After you try a fix, do not judge it on the lead time number alone. Check these three points as well.
Are Output and Quality Holding Up?
Check that reducing WIP has not starved downstream processes and cut output. Likewise, check that shorter changeovers have not left adjustments incomplete and raised defects. Comparing lead time, output, on-time delivery rate, and defect rate over the same period shows whether the change has caused problems elsewhere.
Look beyond the average to the number of rush orders and the slowest lots. If a few extremely slow lots remain, you will still need to pad delivery quotes even after the average has improved.
Has the Waiting Just Moved Somewhere Else?
If you cut in-plant WIP by asking suppliers for frequent small deliveries, or by stacking stock in the finished-goods warehouse, the waiting has only changed location. Check that inventory is not growing outside the span you measure.
The same applies when a plant makes items with no orders just to raise equipment utilization (kado-ritsu). The machines are busy, but what they make sits until it is used. Track utilization and lead time as two separate measures.
Is the Customer Seeing Shorter Lead Times?
Finally, confirm that the time you saved has value for the customer. In make-to-order production, the tests are whether you can actually quote customers a shorter standard delivery time and whether rush requests have dropped.
In make-to-stock production, a shorter manufacturing lead time shortens the period you have to cover with forecasts. Check whether finished-goods inventory has fallen without an increase in stockouts. If procurement lead time is longer and it is what sets delivery dates, the next target may be material ordering.
Japanese Shop-Floor Terms: Quick Reference
These terms come up often in Japanese plants, improvement reports, and conversations with Japanese suppliers. Usage can vary between companies, so confirm the meaning if a term is used in a contract or specification.
| English | Romaji | Japanese | Notes |
|---|---|---|---|
| Production (manufacturing) lead time | seisan lead time | 生産リードタイム | Start to completion of production (JIS Z 8141) |
| Processing | kako | 加工 | Changes shape or properties |
| Transportation (move) | unpan | 運搬 | Changes location |
| Inspection | kensa | 検査 | Pass/fail against a standard |
| Waiting (stagnation) | teitai | 停滞 | Covers both delay and storage |
| Changeover, setup | dandori-gae | 段取り替え | Includes trial processing |
| Internal / external setup | uchi-dandori / soto-dandori | 内段取り/外段取り | Machine stopped / machine running |
| Single setup | shinguru dandori | シングル段取り | Internal setup under 10 minutes; compare SMED |
| One-piece flow | ikko-nagashi | 1個流し | Each piece goes to the next process when done |
| Production leveling | heijunka | 平準化 | Evens out workload and parts withdrawn |
| Pull from the downstream process | ato-kotei hikitori | 後工程引取り | Make only what the next process used |
| Bottleneck | airo | あい路 | "Bottleneck" is also used in Japanese |
| Work-in-process (WIP) | shikakari-hin | 仕掛品 | Released but not finished |
| Rush order | tokkyu-hin | 特急品 | Jumps the normal sequence |
| Make-to-order / make-to-stock | juchu seisan / mikomi seisan | 受注生産/見込生産 |
Lead Time Reduction Checklist
Use this checklist when you start a lead time project, whether in your own plant or together with a Japanese plant or supplier.
- Start and end points agreed (for example, material issue to finished-goods receipt)
- Day-counting rule set: calendar days, working days, or working hours
- One or two target products chosen (late deliveries, frequent rush orders, or high volume)
- Average WIP and daily output counted for the same span and period
- Rough average lead time calculated with Little's Law
- Several lots tracked with arrival, start, and finish times at each process
- Time split into processing (including setup), transportation, inspection, and waiting
- Rush orders and regular orders analyzed separately
- Records checked for each symptom before naming a cause
- One fix chosen from the matching area and tested on one product or one line
- Output, on-time delivery, and defect rate compared for the same period
- Inventory outside the measured span (suppliers, finished goods) checked
- Effect on customer quotes or finished-goods stock confirmed
Questions to Ask a Japanese Supplier or Plant
When a Japanese supplier quotes a lead time, or a Japanese sister plant reports an improvement, these questions help you understand what the number includes. Answers will differ by company and product.
- Where does your lead time start and end: order receipt, material issue, final inspection, or shipment?
- Is it counted in calendar days or working days? How are Japanese holidays handled?
- How much of the lead time is procurement of material or outsourced processing, and how much is in-house production?
- What is the typical lot size for this part, and how often is it produced?
- How long is a changeover (dandori-gae) on the key process?
- Which process is the bottleneck for this product?
- Is any process done in batches, such as heat treatment or plating, or sent to an outside processor?
- Is the quoted figure an average, or does it cover the slowest lots too?
- How is a rush order handled, and does it change the lead time for other orders?
- When you report a lead time reduction, have output, on-time delivery, and defect rate stayed the same?
Limits of This Guide
This guide describes a general approach. How lead time is defined, measured, and reduced depends on the company, the industry, and the product.
- All numbers in Figures 3 and 5 are fictional and only illustrate the method. Measure your own plant.
- The 90–97% waiting share and the changeover calculation come from one Japanese trade magazine article. The article does not state the survey scope or conditions behind the waiting share.
- Little's Law gives an average over a stable period. It does not show where parts wait.
- Department names and roles in Figure 8 differ between companies and plants.
- Batch equipment such as heat-treating furnaces and plating tanks limits how far lot sizes can be reduced. Where procurement lead time is longer, it may set delivery dates more than in-plant time does.
Summary
- Manufacturing lead time is the period from the start of production to completion. Before shortening it, agree on the start and end points and the day-counting rule.
- Its components are processing (including setup), transportation, inspection, and waiting. Waiting rarely appears in records, so you have to measure it on purpose.
- Use two measurement methods: track a lot to see the components, and divide WIP by daily output to estimate the average.
- Fixes fall into five areas: shrinking lots and changeovers, pacing release to the bottleneck, removing plan and information waits, rethinking transportation and inspection, and reducing rework.
- Narrow the target, test small, and confirm the effect together with output, quality, and customer due dates.
Reducing manufacturing lead time is not about installing a particular method. It is about finding where material stops and why, and removing those causes one by one. A good first step is to pick one representative product and count its WIP.
FAQ
Is manufacturing lead time the same as production lead time?
Practically, yes. Both describe the period from the start to the completion of production, as JIS Z 8141 defines production lead time. Still, agree on the exact start and end points within your company.
Should manufacturing lead time be counted in calendar days or working days?
There is no fixed rule. Calendar days suit delivery quotes to customers, while working days or working hours suit tracking improvement inside the plant. Set the rule at the start so you can compare before and after.
How can I calculate manufacturing lead time quickly?
Use Little's Law: divide the WIP within the span by daily output to get an approximate average lead time. It gives only the overall average, so follow a lot to find where it waits.
Does higher equipment utilization shorten lead time?
Not necessarily. If you make items with no orders just to keep machines busy, inventory that waits to be used grows, and lead time can actually get longer. Track utilization and lead time as separate measures.
Where should lead time reduction start?
Pick one representative product with late deliveries or frequent rush orders and count its WIP. Then find where it waits longest and test a fix that matches the cause on one product or one line.
Sources
- Definitions of lead time, production lead time, bottleneck, setup (internal, external, single setup), one-piece flow, process analysis, and heijunka: JIS Z 8141:2001 text, production management terms (Japanese); 2022 revision: Japanese Standards Association, JIS Z 8141:2022 preview (Japanese)
- Production lead time as part of procurement lead time: Japan Institute of Industrial Engineering, "Lead Time" (Japanese)
- Internal and external setup and the order of improvement: Japan Institute of Industrial Engineering, "Setup" (Japanese)
- ECRS principle: Japan Institute of Industrial Engineering, "ECRS Principle" (Japanese)
- Waiting share of lead time and changeover example: Haruo Fujii, "The Impact of Shorter Manufacturing Lead Time on Manufacturers," Kojo Kanri, January 2022, Nikkan Kogyo Shimbun (Japanese)
- Aim of the Toyota Production System: Toyota Motor Corporation, "Toyota Production System"
- Little's Law: John D. C. Little, "Little's Law as Viewed on Its 50th Anniversary" (reprint from Operations Research, Vol. 59, No. 3, 2011)
- Manufacturing lead time components in ERP: Oracle, JD Edwards EnterpriseOne, "Manufacturing Lead Time"
- ASME flow process chart symbols: Wikipedia, "Flow process chart"
- SMED: Lean Enterprise Institute, "Single Minute Exchange of Die"
Original article in JapaneseThis guide is adapted from a MONOSCOPE article written for readers in Japan: 製造リードタイム短縮の全体像|内訳の見方と打ち手を5領域で整理
About the editor
 MONOSCOPE EditorFOUNDER & EDITOR
Spent about ten years at a plant equipment maker and a plant engineering company, proposing, designing, and commissioning equipment, then moved into web marketing. Now a web consultant for B2B manufacturers, helping them explain their products and technology. Licensed in Japan as an Energy Manager and a Third-Class Chief Electrical Engineer.
Has run an engineering blog since 2017 (500+ articles) and a Japanese YouTube channel with about 20,000 subscribers. Each English guide is written from the Japanese shop-floor point of view and checked against the cited standards.