Early Fault Detection in Chemical Plants: Methods & Rollout
Picture this: a feed pump trips at 2 a.m. The DCS alarm fired only when bearing temperature crossed its high limit, even though the trend had been creeping up for days.
Looking back, the warning signs were in the historian all along. Nobody was watching the right combination of signals.
Early fault detection is meant to close that gap. Japanese chemical and refining companies call it kosho yocho kanshi (故障予兆監視, "monitoring for signs of failure"), and you may see the term in Japanese documents and vendor material. The idea is to catch the early signs of equipment failure or abnormal operation in plant data and act before the unit stops.
This guide explains what to monitor, how the data flows, and how the main methods compare: simple thresholds, multivariate statistical process control (MSPC), the Mahalanobis-Taguchi (MT) method, machine learning, and physics-based models. It also covers published cases from Japanese plants, a five-step rollout, common pitfalls, and a checklist and question list you can use with a vendor or the Japanese side.
Contents
- What Is Early Fault Detection in a Process Plant?
- Why Japanese Chemical Plants Are Investing in Early Fault Detection
- What to Monitor: Process, Rotating Equipment, and Static Equipment
- The Data Pipeline: From DCS to Historian
- Detection Methods Compared: Thresholds, MSPC, MT Method, Machine Learning, and Physics-Based Models
- Case Studies From Japanese Plants
- How to Roll Out Early Fault Detection: Five Steps
- Common Pitfalls
- Readiness Checklist Before You Start
- Questions to Ask the Vendor or the Japanese Team
- Limits of This Guide
- FAQ
- Sources
What Is Early Fault Detection in a Process Plant?
Early fault detection uses plant data to spot the precursors of equipment failure or process upset early enough to act before anything stops. Typical precursors are a slow rise in bearing vibration on a pump, or a heat exchanger outlet temperature that drifts a little further from normal each week under the same operating conditions.
Chemical plants and refineries run on a distributed control system (DCS), which controls temperature, pressure, flow, and level and gives operators their main view of the unit. The DCS has alarms, but most of them trip only when a single value crosses a high or low limit. By the time one sounds, the problem is often already visible.
Early fault detection works further upstream. Every individual value can sit inside its normal range while the relationships between values are not normal. Catching that shift gives operators and maintenance staff a chance to respond before the alarm.
The principle is the same as general predictive maintenance. What sets plants apart is scope: instead of watching each machine on its own, you look for early signs across a whole process connected by piping.
The figure below shows how early fault detection fits alongside DCS alarms and routine inspection.
These three do not replace one another. Each works on a different time scale and catches different problems.
Real plants use all three together. Early fault detection does not replace DCS alarms or legally required inspections.
Why Japanese Chemical Plants Are Investing in Early Fault Detection
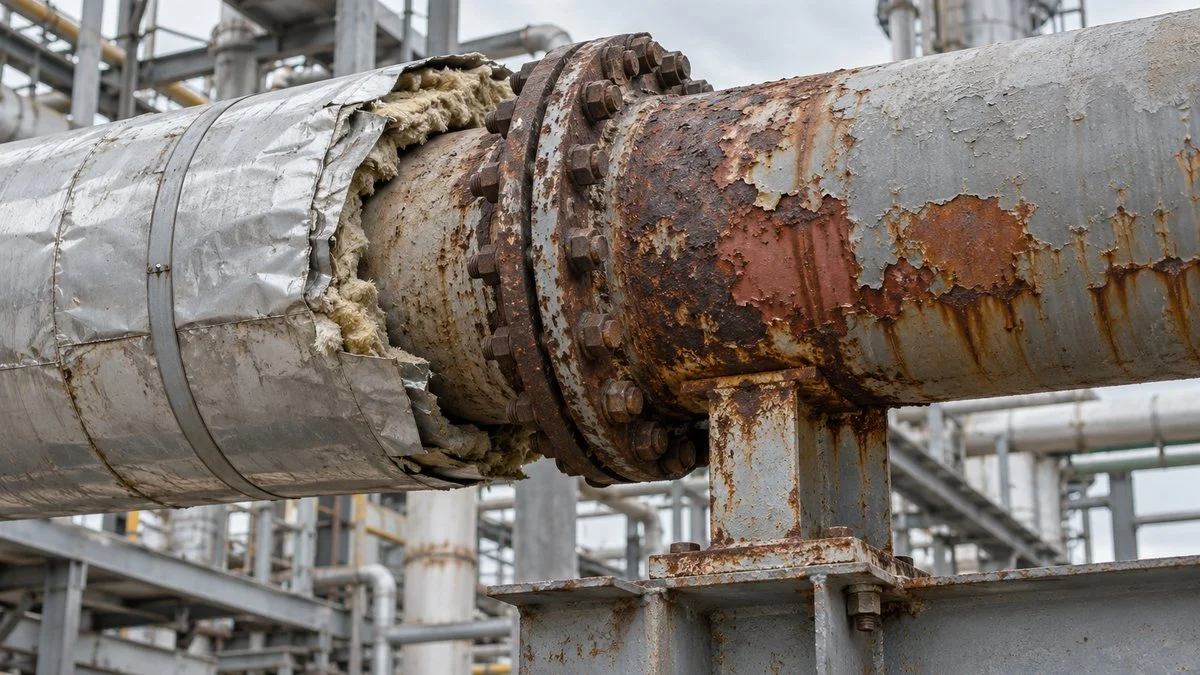
Chemical plants and refineries are continuous processes: feed goes in and product comes out around the clock. In some cases, a single pump stopping forces the whole unit to cut throughput.
Hitachi's technical journal Hitachi Review (2022) describes the situation at Japanese oil and chemical plants, many of them built during Japan's rapid-growth period from the 1950s to the early 1970s. According to the article, it was not unusual for aging-related sudden failures to cause losses of several hundred million to several billion yen, even when no major accident followed. That cost structure tends to favor acting before a stop over repairing after one.
People are the second pressure. Japan's Ministry of Economy, Trade and Industry (METI) lists aging equipment, an aging and shrinking workforce, and weaker transfer of skills as structural challenges for plant safety. It also states that safety systems relying on large amounts of manual work can no longer keep up.
In practice, the gut feeling of a veteran operator ("that temperature rise looks wrong") now has to be backed up by data.
Accident data point the same way. Kanagawa Prefecture, home to the Keihin industrial zone in Yokohama and Kawasaki, reported 53 high-pressure gas accidents in 2024 at sites covered by the petroleum complex regulations (preliminary figures). Poor corrosion management was the leading cause, at 20 cases, and about 70% of the accidents occurred in piping.
The same report identifies equipment deterioration, such as external corrosion, as a main cause of leaks in piping systems. That is why plants now monitor static equipment like piping, columns, and vessels, not only rotating machines.
Regulation is also pushing toward data. Under Japan's High Pressure Gas Safety Act, the certified-operator scheme was revised so that applying condition-based maintenance (CBM) can justify open (internal) inspection intervals longer than the previous 12-year maximum. CBM here means using data to track changes in the operating environment that drive damage such as corrosion.
The extension has strict limits. It applies only to "super-certified" operators with advanced safety capabilities, only to wall thinning as the damage mechanism, and the interval is capped at half the estimated remaining life. These conditions come from METI material dated 2020.
A revised High Pressure Gas Safety Act took effect on December 21, 2023, and introduced a new "certified advanced safety operator" scheme. We have not confirmed how the longer open-inspection interval is handled under the new scheme, so check the current rules before citing any of this.
For AI, METI published the "Guidelines on Assessment of AI Reliability in the Field of Plant Safety" in November 2020, together with a collection of advanced AI use cases in plants. A second edition followed in March 2021. The guidelines explain how to evaluate the reliability of an AI model and how to explain it to people inside and outside the company.
Figure 2 summarizes the four pressures.
Equipment, people, accidents, and regulation are all increasing the need to watch plants through data.
Accident figures are for 2024 at sites under Kanagawa Prefecture's petroleum complex regulations (preliminary).
What to Monitor: Process, Rotating Equipment, and Static Equipment
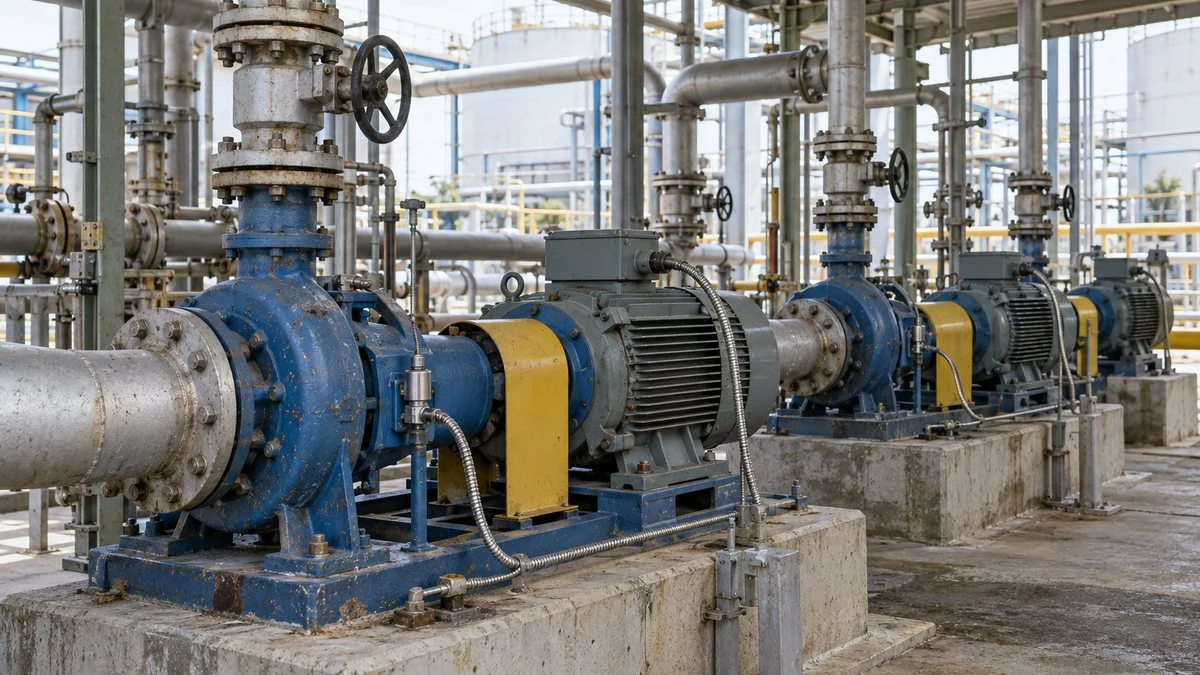
It helps to split monitoring targets into three groups: the process, rotating equipment, and static equipment. Rotating machines such as pumps and blowers and static equipment such as columns and reactors deteriorate in different ways and need different diagnostic techniques. The process itself, meaning abnormal operation, is the third group.
Figure 3 lists the main data and typical warning signs for each group.
The data you use and the signs you look for depend on the target.
Process Upsets
Process problems often show up as operating difficulty before any equipment breaks. Typical examples are plugging, where deposits build up inside piping or a column and restrict flow, and fouling, where heat exchanger surfaces get dirty and lose heat-transfer capacity.
A single reading rarely reveals these problems. You notice them through relationships: pressure drop rising for the same flow, or outlet temperature failing to rise for the same heat input. That is why process monitoring uses methods that handle many variables together.
Rotating Equipment (Pumps, Compressors, Blowers)
Rotating machines have moving parts, so they suffer bearing wear and damage, rotor imbalance, and similar problems. Vibration is the main diagnostic signal, and the basic practice is to measure each bearing in three directions: vertical, horizontal, and axial.
Many plants use a two-tier approach. Field staff take trend readings with portable vibration meters to screen for problems, and specialists then run frequency analysis on suspect machines. Critical machines often get permanently installed sensors for continuous monitoring.
Where you set the judgment criteria affects diagnostic accuracy more than the raw vibration value does.
Static Equipment (Columns, Heat Exchangers, Piping)
Static equipment does not move, but the fluids inside and the weather outside slowly thin and corrode it. Traditionally, wall thickness was measured when the unit was opened up during the scheduled turnaround, called teishu (定修) in Japan. More plants are now adding technologies that measure condition while the unit runs.
A study group under Japan's Fire and Disaster Management Agency (FDMA) surveyed 12 sites, mostly oil and chemical. Nine of them listed 55 monitoring and diagnostic technologies (duplicates included) that were already in use or under consideration.
Examples from the survey include:
- Continuous wall-thickness measurement on piping
- Ultrasonic corrosion monitoring in real time
- Guided-wave testing to screen long runs of insulated piping
- Infrared thermography on furnaces and insulated piping
Because static equipment deteriorates over years, the main use is not instant alarms. Instead, plants estimate remaining life from the thinning rate and use it to schedule repairs.
The Data Pipeline: From DCS to Historian
An analytics model alone does not make an early fault detection system. The system is the whole chain: sensors collect data, a historian stores it, a model analyzes it, people decide and act, and the outcome feeds the next decision.
Figure 4 shows a typical setup.
Monitoring works only when the chain runs all the way from sensors to the action taken by operators and maintenance staff.
This is one example. Some plants add a separate data collection server between the DCS and the historian.
DCS vs. Historian
The DCS controls the plant in real time and is where operators monitor the unit. To analyze years of data, plants usually store it in a plant historian, also called a plant information management system (PIMS).
The PI System, a widely used historian, is designed to keep several years of plant data online. Because early fault detection models learn from past normal operation, how many years of data you have, and at what sampling interval, can make or break the project.
Existing data is not always usable as is. The storage interval may be too coarse, or compression settings may have stripped out small changes.
Combine Data That Never Reaches the DCS
Data outside the DCS matters too. Inspection round records, readings from portable vibration meters, wall-thickness results from turnarounds, and past incident reports are often scattered across paper and spreadsheets.
Once they are linked to detection results, you can quickly answer "Last time this pattern showed up, what was the cause and what did we do?" The benefit is not only better detection but faster, better-informed action afterward.
Detection Methods Compared: Thresholds, MSPC, MT Method, Machine Learning, and Physics-Based Models
The methods are easiest to compare from simplest to most complex. None is "best"; each suits a different target and goal. As the number of signals grows, the focus shifts from single values to the relationships between values.
Figure 5 compares the main options.
The more signals you watch, the more the method moves from "one value" to "relationships between values."
Commercial products often combine several methods, and vendors use different names for them.
Thresholds and Trend Monitoring
The most basic method sets caution and danger levels on values such as vibration or bearing temperature, then tracks both the value and its rate of rise. It is simple, and anyone can explain why an alert fired.
The weakness is that someone has to decide in advance which values to watch. On equipment whose readings shift with season or load, fixed thresholds tend to produce both more false alarms and more missed problems.
MSPC: Principal Component Analysis With T² and Q Statistics
Multivariate statistical process control (MSPC) is the standard statistical approach for process anomaly detection in chemical plants. It uses projection methods such as principal component analysis (PCA) and partial least squares (PLS) to learn how process variables normally move together.
Two statistics do the monitoring. Hotelling's T² flags unusual variation within the patterns the model has learned. The Q statistic, also called the squared prediction error (SPE), flags data that no longer fits those patterns, which is often how a broken correlation shows up.
When either statistic exceeds its control limit, a contribution plot shows which variables pushed it over. MSPC is a common baseline that vendors and in-house data teams compare other methods against. Like the MT method below, it depends heavily on what you treat as "normal" training data.
The MT Method (Mahalanobis-Taguchi)
The Mahalanobis-Taguchi (MT) method comes from quality engineering, often called Taguchi methods, and is widely used in Japan. You first build a set of data that can be treated as normal, called the unit space. You then measure how far the current data is from it using the Mahalanobis distance, which accounts for correlations between variables.
Its strength is turning several signals, such as vibration, internal temperature, and oil pressure, into a single index. By checking each signal's influence on the distance (the signal-to-noise, or SN, ratio), you can also narrow down which signal is driving the anomaly. When there are many signals, they can be split into groups and calculated separately.
The results depend heavily on what goes into the unit space. Mixing data from different operating conditions makes the "normal" range too wide, and real anomalies slip through.
Regression Models (Predicted vs. Measured)
A regression model estimates what a variable should be from related variables, then flags an anomaly when the measured value drifts away from the estimate.
A 2024 technical paper from Azbil describes a method that uses as its target the variable that reacts first when a problem occurs. A neural network learns its relationship to related variables such as flow and valve position.
Because engineers choose the variable combinations from process knowledge, accuracy is high, but each model only covers a local relationship. The paper notes the drawbacks: a large plant needs many models, which takes a lot of engineering effort, and for unknown failure modes it is hard to pick a target variable.
Correlation and Clustering AI
To watch a whole plant with many variables, vendors use AI that learns the relationships among many variables at once and looks for places where those relationships break.
The same Azbil paper tested a method that estimates the correlation structure between variables and classifies operating states at the same time. Using real data from a heavy crude oil pump with bearing damage at a thermal power plant, it detected the change about four hours before operators noticed it from a DCS alarm. The test was run offline on historical data.
Hitachi describes a technique that combines deviation from a normal model with sensor-to-sensor correlations to pinpoint the sensor behind an anomaly. In its published example on utility equipment, the system first flagged a change about 10 days before the failure. The article explains that this early flag reflected a change in production volume, not the failure; the failure-related signal appeared about five days before, with discharge pressure identified as the most influential variable.
That example shows what matters most in practice. A useful system does not just say "something looks abnormal"; it shows which variable or machine is behaving oddly and helps separate real faults from operating changes. Without that, operators end up reviewing every trend themselves.
Physics-Based (First-Principles) Models
Physics-based methods compare measurements with a model built from first principles, such as mass and energy balances or equipment performance curves. A growing residual between the model and the plant points to a fault. Process fault diagnosis literature treats these "quantitative model-based methods" as a separate family from data-driven ones.
Their advantage is that the residual has a physical meaning, so engineers can reason about the cause. Their drawback is the need for an accurate model, which is expensive to build and keep up to date. In practice, many plants use data-driven regression models (above) for points where mass balance or control relationships are well understood.
Case Studies From Japanese Plants
Several Japanese chemical and oil companies have moved past pilot projects and now use early fault detection in daily operation. The cases below are based on the companies' own published material.
Figure 6 separates cases in routine use from technology verification.
Separating routine use from technology verification shows how far each effort has gone.
Based on each company's published material. Results apply to the specific cases and conditions reported.
ENEOS: AI Monitoring Across Tens of Thousands of Refinery Sensors
ENEOS uses Aspen Mtell, an industrial AI system for detecting early signs of equipment problems from Aspen Technology (AspenTech). Verification started at the Sendai Refinery in FY2019, and in March 2025 the company announced it would roll the system out to its refineries and other manufacturing sites.
According to ENEOS, its refineries have tens of thousands of sensors measuring temperature, pressure, vibration, and other values. The aim is to find the seeds of failure in correlations between data that humans cannot discern, which ENEOS expects will help avoid major breakdowns.
Resonac: Pairing Detection With "What to Do Next"
Resonac adopted Hitachi's AI-based anomaly prediction system and data management platform for the ethylene plant at its Oita Complex in southern Japan, with full operation starting in May 2024.
The project digitized operating know-how for about 3,000 alarms (warnings including early signs of abnormal conditions) in ethylene production. When an alarm comes up, the system shows operators the information they need to resolve it, such as past incident reports, operating procedures, and manuals.
What stands out is the focus on supporting action after detection, not only on detection accuracy. Resonac reports that operators now get the same information in about half the time, based on one measured example comparing the new platform with searching a file server.
Linking Detection to AI Operation Support
Alongside early fault detection, Japanese companies are also using AI to support plant operation itself. In 2020, Mitsui Chemicals, NEC, the National Institute of Advanced Industrial Science and Technology (AIST), and Omega Simulation announced results from an operation support system.
The system pairs AI with a "mirror plant," a dynamic simulator that reproduces how the real plant behaves. It cut the time needed to change the production rate by 40% compared with manual operation by operators. Systems that spot early signs of trouble and systems that help operators adjust the plant afterward are likely to become more closely connected.
How to Roll Out Early Fault Detection: Five Steps
Trying to cover the whole plant from day one rarely works. The usual path is to start small on a narrow target, settle the operating rules, and then expand.
Figure 7 shows the five steps in three phases.
Work through three phases: preparation, build and verify, and operation.
Steps 3 and 4 usually go back and forth several times until the criteria settle.
Step 1: Narrow the Target
Start by deciding which equipment and which failures you want to prevent. Good candidates are compressors or pumps with no spare whose trip cuts throughput for the whole unit, and heat exchangers with a history of repeat problems.
List the possible failure modes for each piece of equipment and how severe each would be. That is the fastest way to decide which variables to monitor, and failure mode and effects analysis (FMEA) is a useful framework for it.
Step 2: Inventory the Data
Next, check whether the data you need actually exists. Make a list of how many years of each DCS tag (measurement point) the historian holds and at what interval, where vibration and wall-thickness records are kept, and whether there are records of when past failures happened.
Failure records are essential for evaluating a model. If you can see what the data looked like before past failures, you can test whether a method really gives earlier warning before you commit to it.
Step 3: Define "Normal" and Build the Model
Most detection methods learn normal behavior and then look for deviations from it. So the choice of which periods count as "normal" drives the results.
In a chemical plant, relationships between variables change a lot during startup and shutdown, product grade changes, and before and after a turnaround. Training without separating operating modes widens the normal range and makes real problems easier to miss. Choose the periods together with operators and process engineers.
Step 4: Tune the Criteria in a Trial Run
Once the model is ready, do not go live right away. For a set period, only log the alerts and compare them with operators' judgments. Record whether there was a real problem when an alert fired and whether problems occurred without an alert, then adjust thresholds and the variables included.
Whether the system sticks depends on cutting false alarms until operators feel the alerts are worth reading.
Step 5: Go Live With Response Procedures
Before going live, decide who checks an alert, what they check and in what order, and at what point they hand the job to maintenance. Building the alerts into the maintenance workflow and linking it to inspection and repair plans turns detected signs into actual work.
If you use AI, also document what data the model learned from, how accurate it is, and under what conditions it should not be used. METI's AI reliability guidelines likewise stress being able to explain an AI model's reliability inside and outside the company.
Once the target equipment shows results, extend the system to similar equipment or other units.
Common Pitfalls
These projects stumble more often on day-to-day operation than on technology. Here are the most common ones and how to avoid them.
Too Many False Alarms, So Nobody Looks
The most common problem is a stream of false alarms that leads operators to stop looking. Operating-mode changes, instrument calibration, and brief sensor glitches all look "not normal" to a model, so exclusion rules need to be settled during the trial run.
When cutting alert volume, one effective approach is to route low-priority alerts to maintenance or data analysts instead of operators.
"Normal" Training Data Already Contains a Fault
Sometimes deterioration had already started during the training period. The model then learns the degraded state as normal and cannot detect the same pattern later.
When choosing training periods, check them against maintenance records. It is safer to choose periods when equipment condition is known, such as right after a repair or part replacement.
Nobody Owns the Alert
If it is unclear whether operations or maintenance should check an alert, alerts go unanswered. This tends to happen when only the digital transformation (DX) team or instrumentation engineers run the project.
Bring operations and maintenance in from the start, and assign a first responder and a response deadline for each type of alert. That is what turns the system into part of daily work.
The Model Is Never Updated
Equipment modifications, catalyst changes, and changes in feedstock or product mix all change the relationships between variables, and the old model stops fitting. A model that worked well at launch can produce more false alarms as conditions change.
Make model reviews part of the maintenance plan, timed with turnarounds and equipment modifications, to keep accuracy up.
Readiness Checklist Before You Start
Early fault detection is not a tool the data team installs and walks away from. Operations and maintenance build it up over time, together with instrumentation and data staff, starting from a narrow target and folding response procedures and model reviews into daily work.
Use this list in a kickoff meeting or when reviewing a vendor proposal. It follows the five steps and the pitfalls above.
| Area | Check |
|---|---|
| Target | Specific equipment and failure modes are named, with the impact of a stop (throughput loss, safety, repair cost) |
| Target | Spare equipment status is known (installed spare or none) |
| Historian data | Years of history available for each tag, sampling interval, and compression settings are confirmed |
| Historian data | Tag list includes engineering units, ranges, and known bad or replaced instruments |
| Non-DCS data | Inspection rounds, portable vibration readings, thickness data, and incident reports are located and can be linked by equipment tag and date |
| Failure history | Dates and causes of past failures are available for back-testing |
| Normal periods | Operating modes (startup, shutdown, grade changes, turnaround) are identified and normal periods are chosen with operators |
| Trial run | Trial period length, success criteria, and how false alarms and misses will be logged are agreed |
| Response | First responder, escalation path to maintenance, and response deadline are set for each alert type |
| Model upkeep | Model review is scheduled with turnarounds, catalyst changes, and equipment modifications |
| AI documentation | Training data, accuracy, and conditions where the model should not be used are recorded |
Questions to Ask the Vendor or the Japanese Team
If the system comes from a Japanese vendor, or your Japanese headquarters is rolling it out to your site, these questions help you understand what you are getting.
- Which method does the system use (thresholds, MSPC, MT method, regression, correlation-based AI, physics-based model), or which combination?
- When an alert fires, does it show which variables or equipment contributed? How?
- How many years of historian data, at what sampling interval, do you need for training?
- How do you handle different operating modes, such as startup, shutdown, and grade changes?
- Were the published detection results (for example, "hours" or "days" before failure) from live operation or offline tests on historical data?
- What false-alarm rate did you see in the trial run, and how was it reduced?
- Who retrains the model after a turnaround or equipment change, and is that in the contract?
- Can alerts be routed to different people by priority (operators vs. maintenance vs. data team)?
- Does the system connect to our DCS and historian as installed, or does it need a separate collection server?
- How is the model documented for reliability review (for example, against METI's AI reliability guidelines)?
Limits of This Guide
- Case study results are from each company's published material and apply only to the reported conditions. Several were offline tests, not live operation.
- Product names and method labels differ between vendors. Confirm the actual algorithm with the supplier.
- The regulatory points (Japan's High Pressure Gas Safety Act, inspection intervals) apply only in Japan, and the certification scheme was revised in December 2023, so check the current rules. Plants elsewhere must follow their own local rules.
- Early fault detection does not replace DCS alarms, safety systems, or legally required inspections. Decisions on inspection intervals and safety remain with the plant's responsible engineers and the authorities.
- Accident figures for Kanagawa Prefecture are preliminary 2024 data for one region and do not represent all of Japan.
FAQ
How Is Early Fault Detection Different From Predictive Maintenance?
The core idea is the same: read the condition of equipment to catch signs of failure early. In a process plant, however, early fault detection also looks across the whole process connected by piping, not only at each machine on its own.
What Is CBM (Condition-Based Maintenance)?
CBM sets maintenance timing based on equipment condition instead of a fixed interval, using data to track the environmental changes that drive damage such as corrosion. In Japan, CBM could justify open inspection intervals beyond 12 years for high-pressure gas equipment under the pre-2023 rules, but only for qualifying operators and only for wall thinning.
Check how the current scheme treats this.
Can You Do Early Fault Detection Without AI?
Yes. Threshold and trend monitoring, MSPC, and the MT method do not require AI or machine learning. For rotating equipment where the key values are clear, simple methods also make it easier to explain why an alert fired.
What Is the Difference Between MSPC and the MT Method?
Both learn from normal data and use correlations between variables. MSPC projects the data onto principal components and watches two statistics (T² and Q/SPE), while the MT method uses a single Mahalanobis distance from a "unit space" of normal data and the SN ratio to find contributing signals.
What Data Do You Need to Start?
You need operating data stored from the DCS in a historian, plus inspection round records, vibration readings, wall-thickness results from turnarounds, and records of past failures. Failure records are especially valuable, because they let you test before rollout whether a method really warns earlier.
Sources
- Losses from aging-related failures; Hitachi detection technique and utility equipment example: Hitachi Review, "Predictive diagnosis technology for aging domestic plant equipment" (2022, Japanese)
- Structural challenges of plant safety; CBM and open inspection intervals over 12 years: METI, "Initiatives to promote smart industrial safety" (FDMA materials, Japanese)
- Certification scheme reorganization (December 21, 2023): METI press release (December 21, 2023, Japanese)
- AI reliability guidelines: OECD.AI, "Guidelines on Assessment of AI Reliability in the Field of Plant Safety"; METI, Smart Industrial Safety (Japanese)
- High-pressure gas accidents in 2024: Kanagawa Prefecture, "Abnormal events and high-pressure gas accidents" (March 2025, Japanese)
- Monitoring and diagnostic technologies in use: FDMA study group, "Survey of monitoring and diagnostic technologies" (Japanese)
- Rotating equipment diagnosis in chemical plants: Juntsu Net 21, "Using rotating equipment diagnostic tools in chemical plants" (Japanese)
- PI System: Yokogawa Technical Report, "Plant information system PI" (Japanese)
- MSPC with PCA and PLS: MacGregor, J. F., and Kourti, T., "Statistical process control of multivariate processes," Control Engineering Practice 3 (1995): 403–414
- MT method: Mitsubishi Heavy Industries, "MT System" (Japanese)
- Regression and correlation-based anomaly detection: azbil Technical Review, "Extending an online anomaly prediction system for large plants" (2024, Japanese)
- Physics-based (quantitative model-based) methods: Venkatasubramanian, V., et al., "A review of process fault detection and diagnosis, Part I: Quantitative model-based methods," Computers & Chemical Engineering (2003)
- ENEOS: ENEOS news release on Aspen Mtell anomaly detection at refineries (March 3, 2025, Japanese); ENEOS Holdings, ENEOSWAYS, refinery DX and AI (April 8, 2026, Japanese)
- Resonac: Resonac news release, "Hitachi and Resonac build a digital platform at the Oita Complex" (July 29, 2024, Japanese); DIGITAL X, Resonac plant anomaly detection system (2024, Japanese)
- Mitsui Chemicals operation support AI: Mitsui Chemicals news release (November 16, 2020, Japanese)
Original article in JapaneseThis guide is adapted from a MONOSCOPE article written for readers in Japan: プラントの故障予兆監視とは|化学プラントで使われる手法と導入の進め方
About the editor
 MONOSCOPE EditorFOUNDER & EDITOR
Spent about ten years at a plant equipment maker and a plant engineering company, proposing, designing, and commissioning equipment, then moved into web marketing. Now a web consultant for B2B manufacturers, helping them explain their products and technology. Licensed in Japan as an Energy Manager and a Third-Class Chief Electrical Engineer.
Has run an engineering blog since 2017 (500+ articles) and a Japanese YouTube channel with about 20,000 subscribers. Each English guide is written from the Japanese shop-floor point of view and checked against the cited standards.