Vibration Analysis Basics: ISO 20816 Limits & Fault Patterns
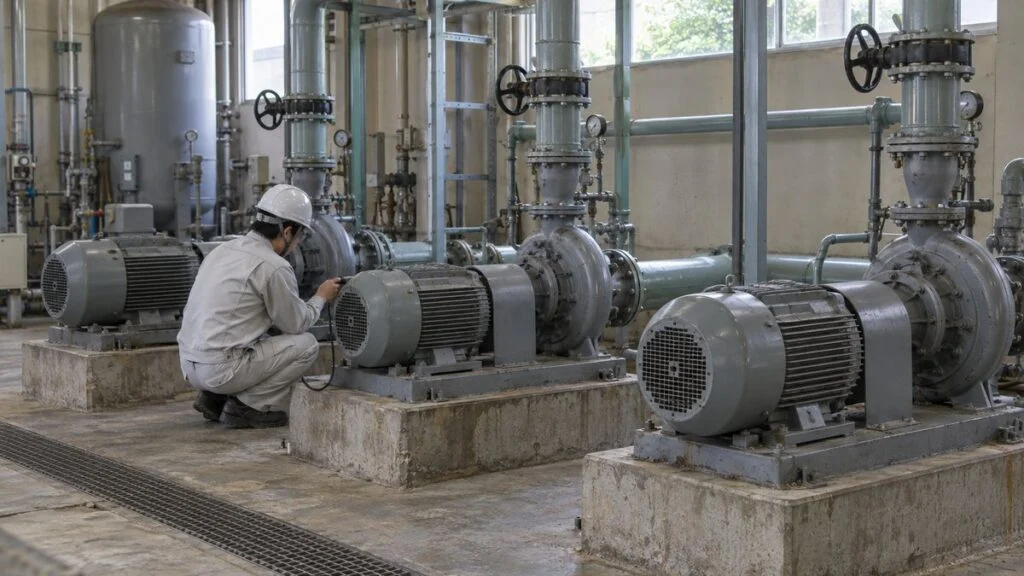
Picture this (a fictional example): a Japanese maintenance contractor sends a vibration report on a pump set: measurement points numbered 1 to 4, columns labeled H, V, and A, values in mm/s, and a verdict for each point marked ryo, chui, or kiken (good, caution, danger).
The report cites ISO 10816 or JIS B 0906. To act on it, you need to know where those points are, what was measured, and which criteria produced the verdict.
Vibration analysis (shindo shindan, 振動診断) measures the vibration of rotating machines and uses it to judge their condition. A damaged motor or pump bearing often shows up as a change in vibration before the machine fails.
With a handheld vibration meter and fixed rules for where, how, and against what to measure, maintenance staff can catch early signs of trouble themselves. Pinning down the root cause is usually treated as a separate, more detailed stage. This guide walks through both in five steps, then covers common mistakes, a checklist, and questions to send to the Japanese side.
Contents
- What Vibration Analysis Tells You
- Vibration Analysis in Five Steps
- Step 1: Choose Machines and a Monitoring Method
- Step 2: Set Measurement Points and Directions (H, V, A)
- Step 3: Measure the Same Quantity Every Time
- Step 4: Apply Severity Criteria (ISO 10816 / ISO 20816)
- Step 5: Recognize Fault Patterns and Plan the Fix
- Common Mistakes in Vibration Analysis
- Quick Reference: Terms in Japanese Vibration Reports
- Checklist: Before You Trust a Vibration Report
- Questions to Ask the Japanese Side
- Limits of This Guide
- FAQ
- Sources
What Vibration Analysis Tells You
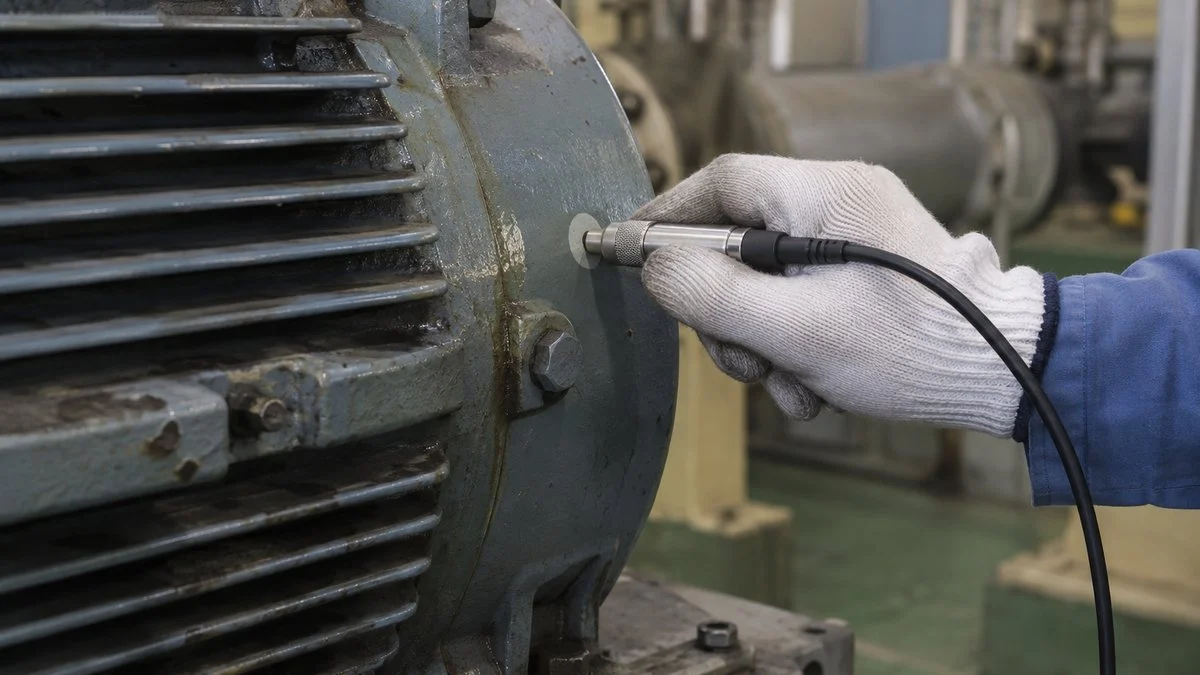
Vibration analysis looks at both the size of the vibration and what it is made of to judge the condition of motors, pumps, fans, and other rotating machines. Unbalance in a rotor, misalignment between shafts, and damaged bearings often change the vibration long before they cause a breakdown.
Japanese training material describes equipment diagnostics as measuring a machine's present condition in numbers, predicting faults, their causes, and their future effects, and deciding what to do about them. In practice, it turns listening and touching during inspections into numbers you can compare over time.
Vibration analysis is a core tool of condition-based maintenance. Instead of replacing parts on a fixed schedule, you plan work when signs of deterioration appear, which can cut both unnecessary part replacement and unplanned breakdowns.
Whether a machine is better served by time-based or condition-based maintenance depends on its criticality and how its failures develop.
Japanese practice splits the work into two stages with different goals:
- Simple (screening) diagnosis (kan'i shindan, 簡易診断): decides whether a problem exists and how serious it is, and flags the machines that need a closer look.
- Precision diagnosis (seimitsu shindan, 精密診断): identifies the type, location, cause, and severity of the problem and estimates how long the machine can keep running.
Figure 1 shows how the two stages fit together.
Screen many machines quickly, then dig into only the suspect ones.
Precision diagnosis may be done by an in-house specialist or contracted to a diagnostic service company.
Screening covers many machines lightly; precision diagnosis covers a few machines deeply. Trying to analyze every machine in depth from day one takes too much effort to sustain. Get the screening routine running first, then spend analysis time on the machines it flags.
Vibration Analysis in Five Steps
Vibration analysis is more than holding a meter to a machine and reading a number. Decide in advance which machines to measure, where, in which quantity, against which criteria, and how to narrow down the cause. That way you build up data that stays comparable no matter who takes the reading.
Two preparation steps fix how you measure; the rest cover measuring, judging, and finding the cause.
Steps 1 and 2 are set once and revisited only when equipment is replaced or modified.
Step 2 (measurement points) and Step 3 (consistent quantities) make the biggest difference in the field. If the location or the way the sensor is held shifts from one reading to the next, the values scatter even when the machine has not changed, and the verdict can no longer be trusted.
Step 1: Choose Machines and a Monitoring Method
Vibration analysis suits machines with rotating parts and bearings: motors, pumps, fans, blowers, compressors, and gear reducers. When choosing which ones to include, consider:
- How much a stoppage would affect production or safety
- Whether a standby unit exists
- Whether the machine has a history of failures
You do not need to measure every rotating machine in the plant at the same frequency; most plants scale the effort to criticality. At the same time, decide how each machine will be monitored. Figure 3 compares the three usual methods: route-based checks with a portable meter, permanently mounted sensors wired to a terminal box, and continuous monitoring.
The right method depends on how easy the machine is to reach and how fast it deteriorates.
Based on the classification in Asahi Kasei Engineering's vibration diagnosis course (Japanese). Wireless sensors are increasingly used to cut the installation effort of continuous monitoring.
Rather than installing continuous monitoring widely from the start, use route-based checks to settle your baselines and learn to read the data, then move critical machines to continuous monitoring. That order tends to cause fewer problems.
AI-based predictive maintenance systems that estimate time to failure rest on the same measurement and evaluation principles.
Once the machines are chosen, record the following in the equipment register:
- Equipment (tag) number
- Rated output
- Running speed
- Bearing designations
You will need the running speed and bearing designations in Step 5, when you use frequencies to narrow down the cause.
Step 2: Set Measurement Points and Directions (H, V, A)
As a rule, measure on the casing that supports each bearing. Faults in the rotor reach the outside through the bearings, so the best location is the solid surface closest to the bearing.
Measuring on covers, thin sheet metal, or other flexible parts adds the panel's own movement, so the reading comes out higher than the bearing's actual vibration and the verdict can be wrong. On a typical direct-coupled motor and pump, the four standard points are the two motor bearings and the two pump bearings.
Japanese documents often label motor ends by "load side" rather than "drive end," so it helps to know both sets of terms:
- Point 1: motor non-drive end (han-fuka-gawa, 反負荷側, "opposite-load side")
- Point 2: motor drive end (fuka-gawa, 負荷側, "load side")
- Point 3: pump drive end (kudo-gawa, 駆動側)
- Point 4: pump non-drive end (han-kudo-gawa, 反駆動側)
At each of the four bearings, measure in the horizontal, vertical, and axial directions.
The arrows show point 2 as an example. Ideally you measure all three directions at every point, but to save time some plants take the axial reading at only one point per machine.
The three directions are horizontal (H), vertical (V), and axial (A). Different faults push the vibration in different directions, so recording each direction separately makes the later diagnosis much easier. Unbalance, for example, tends to show up in the horizontal direction, while misalignment also shows up axially.
Mark Each Measurement Point
Mark each point with a sticker or paint so that anyone taking the reading puts the sensor in the same place. Moving even a few centimeters can change the value, which undermines trending.
On thick paint or rough cast surfaces, a flat measuring surface can be prepared (for example by a flat pad), but only as your site's rules and the equipment owner allow. Avoid recesses and corners. For stable readings, hold the sensor square to a flat surface with the same pressure every time.
Readings are taken right next to running machinery. Decide in advance where the technician stands so nothing can be caught in rotating parts, and make it a rule that no measurement point requires removing a guard.
Step 3: Measure the Same Quantity Every Time
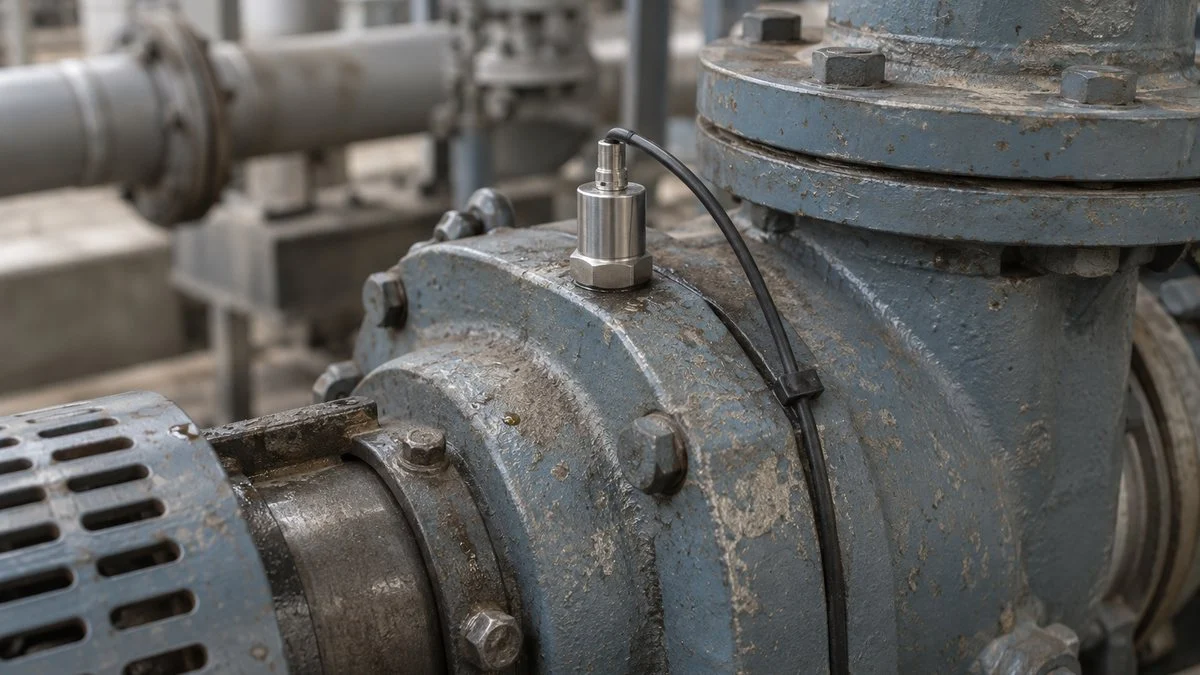
Vibration can be expressed as displacement, velocity, or acceleration. Each quantity covers a different frequency range and picks up different faults, so choose the one that fits your purpose and record the same quantity every time.
For routine screening of general rotating machines, rms vibration velocity in mm/s is the most widely used quantity. It works well below about 1,000 Hz, where common faults such as unbalance, misalignment, and looseness appear.
Pick the quantity that matches the fault you want to find.
For screening rotating machines, the basic pairing is velocity for overall condition and acceleration for bearing condition
Frequency ranges are approximate, per Rion's explanation of vibration meters (Japanese). The measurable range depends on the instrument.
A metric often used alongside acceleration is the crest factor: the peak value of the waveform divided by its rms value. It shows how impulsive the vibration is. When a bearing has only a tiny flaw, the crest factor rises even while overall vibration is still low, which makes it a useful early warning.
US readers often work in inch units. To convert rms velocity, divide mm/s by 25.4 to get in/s (for example, 4.5 mm/s is about 0.18 in/s).
Some meters and reports give velocity as peak rather than rms. For a pure sine wave, peak equals rms × 1.414, but real machine signals are not pure sine waves, so confirm which value a report uses before comparing.
Record the Operating Conditions
Vibration also changes with speed, load, and temperature. The same machine reads differently just after startup than after warming up, and at light load than at rated load. Measure under the same operating state as far as possible, and record the speed and load with each reading.
Keep the log as a table with one row per reading: equipment number, point, direction, quantity, value, operating conditions, technician, and date and time. That makes it easy to plot later. How readings taken under the same conditions change over time tells you more than any single value.
Comparisons also assume the meter itself reads correctly. A meter that is past its calibration date, or a sensor that has been dropped, can introduce a step in the trend that has nothing to do with the machine.
Before comparing with the previous reading, confirm that the items below are the same. If any one differs, you cannot tell whether a change comes from the machine or from the way it was measured.
| Item | Keep the same |
|---|---|
| Measurement point | The same marked location |
| Direction | Horizontal, vertical, or axial |
| Operating state | Speed, load, and whether the machine is warmed up |
| Quantity | Displacement, velocity, or acceleration; rms or peak |
| Meter settings | Frequency range and filters |
| Sensor mounting | Handheld, magnetic base, or other mounting method |
Step 4: Apply Severity Criteria (ISO 10816 / ISO 20816)
To decide whether a reading is good or bad, you need criteria. There are three broad approaches: absolute, relative, and comparative. In practice, use them together rather than relying on any one.
Absolute Criteria: Compare with ISO Limits
Absolute criteria compare a reading with predefined limits. The best-known example is ISO 10816, the international standard for evaluating vibration measured on non-rotating parts of machines. It uses rms vibration velocity (mm/s) measured at or near the bearing housings and sorts machine condition into four zones, A through D.
ISO 10816 has since been merged with ISO 7919 (shaft vibration) and reissued, part by part, as the ISO 20816 series:
- ISO 20816-1:2016 (general guidelines) replaced ISO 10816-1:1995 and ISO 7919-1:1996.
- ISO 20816-3:2022 (industrial machines) replaced ISO 10816-3:2009 and ISO 7919-3:2009. It covers machines rated above 15 kW running at 120–30,000 r/min.
A second edition of ISO 20816-3 was at the final draft stage (ISO/FDIS) as of late 2026, and one standards catalog already lists the 2022 edition as replaced by a 2026 edition. We could not confirm the published text, so check the current edition and whether its groups or limits changed.
On the Japanese side, the general guideline is JIS B 0906:1998, "Mechanical vibration – Evaluation of machine vibration by measurements on non-rotating parts – General guidelines." It is a translation of ISO 10816-1:1995 with no technical changes, so it corresponds to the old Part 1, not to ISO 20816-1.
We did not find a JIS that adopts ISO 10816-3 or ISO 20816-3, so if a Japanese report cites JIS for zone limits, ask which document and edition the limits came from.
The same zone has different limits depending on machine size and how stiffly the machine is supported.
Values are rms velocity: the ISO 10816-3:2009 boundaries as compiled from vendor explanations, shown as a guide. One vendor summary lists the same values for ISO 20816-3:2022. Group 1: roughly above 300 kW (electric machines with shaft height above 315 mm). Group 2: 15–300 kW (shaft height 160–315 mm). Confirm groups and values against the current standard before using them.
A rigid support means the machine is bolted firmly to a heavy, stiff foundation. A flexible support means the foundation itself can move to some degree, as when the machine sits on spring isolators. Picking the wrong support type can shift the verdict by a full zone, so record in the equipment register which category applies to each machine.
Crossing the C/D boundary does not automatically mean you must shut the machine down. Weigh it against:
- The machine's criticality
- Whether a standby unit is available
- How fast the values are rising
Conversely, a sudden rise within Zone B is a sign that something is happening and deserves attention.
Relative and Comparative Criteria
Relative criteria use the machine's own normal reading as the baseline and judge by how many times it has grown. ISO 20816 also includes the idea of evaluating significant changes in vibration, up or down, in addition to the absolute level.
Comparative criteria apply when you have several machines of the same specification: line up their readings side by side. If three identical pumps sit in a row and one reads much higher, that one probably has a problem.
Compare against a standard, against the machine's own history, and against its siblings.
Ratios vary between sources. Some set the alarm at 2–3× the baseline and the trip level at about 10×. Refine them from your own equipment's history
Ratio examples from Asahi Kasei Engineering's vibration diagnosis course, Part 6, and Rion's guide to screening diagnosis (both Japanese).
When a program is new, use absolute criteria to catch large deviations, then lean more on relative criteria as data builds up. Knowing each machine's normal reading does more for diagnostic accuracy than anything else.
Step 5: Recognize Fault Patterns and Plan the Fix
Machines rated caution or worse in screening move on to diagnosis. The main tool is frequency analysis (FFT analysis), which breaks the vibration down into how much of each frequency it contains.
Each fault in a rotating machine appears at characteristic frequencies. The reference is the running-speed frequency (1×, written fr in Japanese material): the speed in r/min divided by 60.
A motor running at 1,800 r/min, for example, has a running frequency of 30 Hz. The basic skill is reading each peak in the spectrum as a multiple of running speed.
Combine frequency features with the direction in which vibration is strongest.
Based on Asahi Kasei Engineering's vibration diagnosis course, Parts 9–11, and Rion's guide to precision diagnosis (both Japanese). Faults often overlap, so never diagnose from a single peak.
Unbalance
Unbalance means the rotor's mass is not evenly distributed around the shaft. Causes include impeller wear or thinning, uneven scale buildup, and a bent rotor.
Once per revolution the heavy side pulls on the shaft, so the vibration matches the running frequency and is usually strongest in the horizontal direction. The unbalance force, and with it the vibration, rises roughly with the square of speed.
On fans and pumps, simply cleaning off the buildup often brings the vibration down. If there is no buildup and the level is still high, consider field balancing or replacing the impeller.
Misalignment
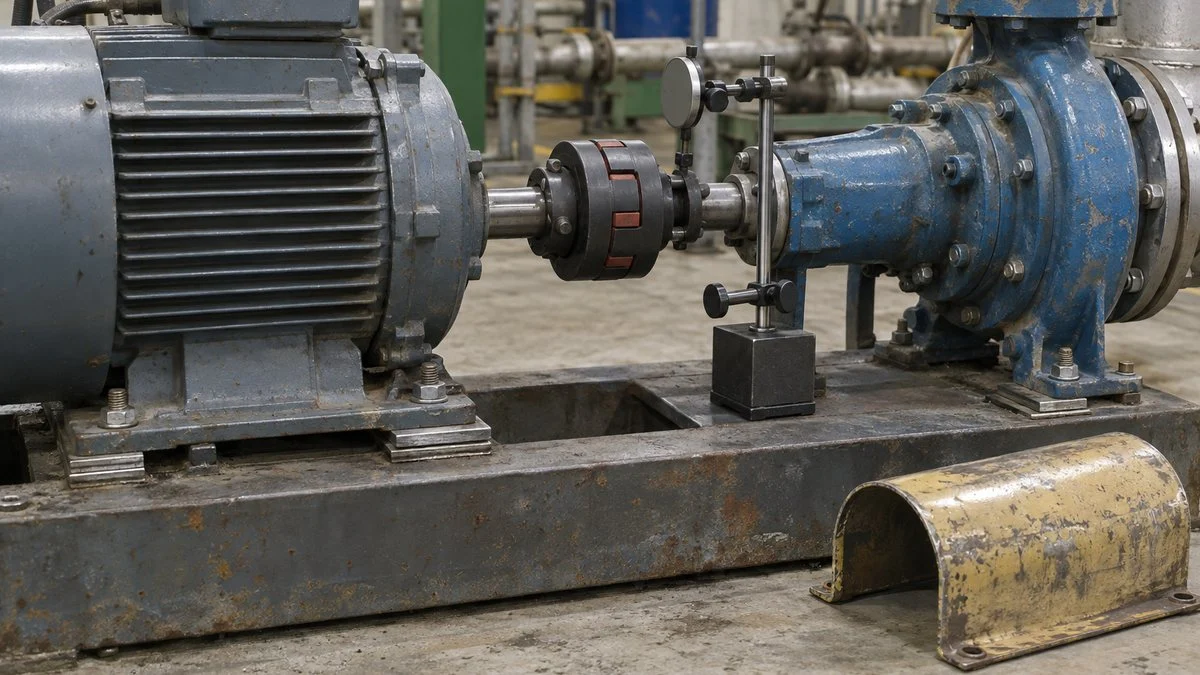
Misalignment means the centerlines of two coupled shafts, such as a motor and a pump, do not form a straight line. The shafts can be offset in parallel (parallel misalignment), meet at an angle (angular misalignment), or both.
Besides the 1× component, 2× and 3× components appear as the misalignment grows, and axial vibration increases. That axial rise is the key clue.
Even a machine aligned at installation can drift because of pipe loads, foundation settlement, or thermal growth. After disassembly for work such as a bearing replacement, realign (shindashi, 芯出し) the shafts during reassembly.
Looseness
Looseness means parts can rattle because anchor bolts or bearing caps have worked loose or a bearing fit has become slack. It typically produces a 2× component and the natural frequency of the loose part.
Looseness alone rarely causes large vibration, but combined with unbalance or misalignment it can amplify the vibration sharply. If the level will not come down after you fix another fault, check for hidden looseness.
Rolling Bearing Damage
When a flaw forms on the outer race, inner race, rolling elements, or cage of a rolling bearing, each rolling element produces a small impact as it passes over the flaw. You can calculate how often these impacts repeat from the bearing geometry, the number of rolling elements, and the speed. The results have names such as BPFO (ball pass frequency, outer race) and BPFI (ball pass frequency, inner race).
Early damage produces small impacts that barely show in the velocity reading. Envelope analysis solves this by extracting only the repeating impacts from the high-frequency vibration.
If evenly spaced peaks line up with a calculated defect frequency, you can estimate where the damage is. This is why Step 1 asks you to record the bearing designations.
Once you have a likely cause, decide what to do and when. From the zone and the trend, judge whether the machine can run to the next planned shutdown or needs an unscheduled stop, then arrange parts and plan the work.
Before working on the machine, follow your site's lockout/tagout procedure to isolate energy.
Common Mistakes in Vibration Analysis
The method itself is not difficult. When plants "measure but still can't prevent failures," the cause usually lies in how they measure and how they run the program. Here are five common mistakes.
Measuring in a Different Place or Way Each Time
Without marked points, each technician holds the sensor in a slightly different spot, the scatter grows, and real changes get lost in the noise. Differences in pressure or angle also change the reading. Marked points plus a written measurement procedure are where every program should start.
Judging from a Single Reading
A typical case: today's reading is in ISO Zone B, so the machine is declared fine. But if the value has doubled since last time, something is happening, even inside Zone B. Always check whether the value has risen since the last reading and whether the rise is speeding up.
Watching Only Velocity and Missing Bearing Damage
Velocity is excellent for overall machine condition, but early bearing damage barely shows in it. To avoid a bearing that seizes "out of nowhere" while velocity looks normal, also record acceleration and crest factor.
Diagnosing from a Single Peak
Calling it unbalance because there is a peak at running speed is risky. Misalignment and looseness also produce a 1× component, and several faults often occur together.
Combine readings by direction, harmonics, past trends, and the machine's history to reduce misdiagnosis.
Collecting Data That Never Leads to Action
Sometimes measuring and recording become the goal: a caution verdict comes in and nobody acts. Unless you decide in advance who does what, and by when, for each verdict, vibration analysis becomes a box-ticking exercise. Build the path from diagnosis to an updated maintenance plan into the program itself.
None of this requires buying specialized equipment all at once. You can start by fixing where and how to measure and keeping consistent records.
Quick Reference: Terms in Japanese Vibration Reports
Japanese vibration reports and inspection sheets often use the terms below. Exact wording varies by company, so treat this as a starting point.
| Japanese | Romaji | Meaning |
|---|---|---|
| 振動診断 | shindo shindan | Vibration analysis / vibration diagnosis |
| 簡易診断 / 精密診断 | kan'i shindan / seimitsu shindan | Screening diagnosis / precision (detailed) diagnosis |
| 測定点 | sokutei-ten | Measurement point |
| 水平 / 垂直 / 軸方向 | suihei / suichoku / jiku-hoko | Horizontal (H) / vertical (V) / axial (A) |
| 負荷側 / 反負荷側 | fuka-gawa / han-fuka-gawa | Drive end (DE) / non-drive end (NDE), mainly for motors |
| 振動速度(実効値) | shindo sokudo (jikko-chi) | Vibration velocity (rms) |
| 波高率 | hako-ritsu | Crest factor |
| 剛支持 / 柔支持 | go-shiji / ju-shiji | Rigid support / flexible support |
| 良 / 注意 / 危険 | ryo / chui / kiken | Good / caution / danger (verdict levels; thresholds vary by company) |
| 芯出し | shindashi | Shaft alignment |
Checklist: Before You Trust a Vibration Report
Whether the data comes from your own team or a Japanese contractor, confirm these points before comparing readings or acting on a verdict.
- Points: a sketch or photo showing where each numbered point is, and confirmation that the points are marked
- Directions: H, V, and A recorded separately, and where the axial readings were taken
- Quantity: velocity, acceleration, or displacement; rms, peak, or peak-to-peak; units (mm/s, in/s, m/s², µm)
- Meter: model, frequency range, filter settings, and calibration date
- Mounting: handheld, magnetic base, or stud-mounted sensor
- Operating state: speed, load, and whether the machine was warmed up
- Criteria: the standard and edition (ISO 10816-3, ISO 20816-3, JIS B 0906, or a company rule), the machine group, and rigid or flexible support
- Baseline: the machine's normal reading and the ratio used for caution and danger
- Trend: previous readings taken under the same conditions
- Machine data: running speed and bearing designations, needed for frequency analysis
Questions to Ask the Japanese Side
When you receive a report from a Japanese supplier or contractor, or commission one, these questions settle most of the ambiguity early:
- Which standard and edition were the verdicts based on? If ISO 10816-3, have you checked the limits against ISO 20816-3:2022?
- Which machine group and support type (rigid or flexible) did you assume for each machine?
- Are the values rms or peak? What frequency range did the meter use?
- What do ryo, chui, and kiken mean numerically in this report: ISO zones, ratios to a baseline, or company limits?
- Can you send a sketch of the measurement points, including which end is fuka-gawa and which is han-fuka-gawa?
- For machines rated caution or worse, can you share the FFT spectrum (and envelope spectrum for bearings) rather than overall values only?
- What are the bearing designations and running speed used for the defect-frequency calculation?
Limits of This Guide
- Zone boundary values come from vendor summaries of ISO 10816-3 and ISO 20816-3. Confirm them against the current standard before using them for acceptance decisions.
- ISO 20816-3 covers industrial machines above 15 kW at 120–30,000 r/min. Check that your machine falls within that scope before applying its zones. A second edition was in final approval at the time of writing, so confirm the current edition.
- Ratios for relative criteria (2×, 4×, 10×) are examples from Japanese training material, not standard values. Each plant sets its own.
- Fault signatures are typical patterns. Real machines often show several faults at once, and confirming a cause takes precision diagnosis.
- Whether to keep running or shut down is a decision for the plant's maintenance and operations owners, based on criticality, spares, and trend.
FAQ
Should I Use ISO 10816 or ISO 20816?
Use ISO 20816 where it replaces the matching part of ISO 10816. ISO 20816-3:2022 replaced ISO 10816-3:2009 for industrial machines (a second edition was in final approval at the time of writing), and ISO 20816-1:2016 replaced ISO 10816-1. Many reports and older specifications still cite ISO 10816, so check groups and limits against the current edition.
What Is the JIS Equivalent of ISO 10816?
JIS B 0906:1998 is a translation of ISO 10816-1:1995 (general guidelines) with no technical changes. We did not find a JIS that adopts ISO 10816-3 or ISO 20816-3, so confirm with the supplier where any zone limits in a Japanese report come from.
Should I Measure Vibration Velocity or Acceleration?
Both, for different purposes. Use rms velocity for the overall condition of the machine, and acceleration with crest factor for bearings. Early bearing damage barely shows in velocity, so recording both reduces missed faults.
How Often Should Vibration Be Measured?
There is no single rule; the interval depends on criticality and how fast the machine deteriorates. Critical or fast-deteriorating machines suit continuous monitoring, while accessible, slow-deteriorating machines suit route-based checks.
Is There a Certification for Vibration Analysts?
Yes: ISO 18436-2 sets requirements for vibration analysts in four categories. In Japan, the Japan Society of Mechanical Engineers (JSME) certifies analysts based on ISO 18436-2.
Category I covers taking correct measurements, and Category II adds basic analysis and evaluation against standards. Higher categories extend to planning monitoring programs and advanced analysis.
Sources
- Equipment diagnostics, screening vs. precision diagnosis, monitoring methods: Asahi Kasei Engineering, vibration diagnosis course, Part 1 (Japanese)
- Measurement points, directions, and sensor mounting: Asahi Kasei Engineering, Part 5 (Japanese)
- Ratio examples for relative criteria: Asahi Kasei Engineering, Part 6 (Japanese)
- Unbalance, misalignment, and looseness: Asahi Kasei Engineering, Part 9 and Part 10 (Japanese)
- Measured quantities, frequency ranges, crest factor, criteria types: Rion, "Vibration and vibration meters: simple diagnosis" (Japanese)
- Frequency analysis and envelope processing: Rion, "Vibration and vibration meters: precision diagnosis" (Japanese)
- ISO 20816-3 zone boundaries and machine groups: Vibromera, "ISO 20816-3 Vibration Limits"; IMV, vibration measuring methods
- ISO 20816-3:2022 scope and replaced documents: SIS, ISO 20816-3:2022
- ISO 20816-1:2016 and replaced documents: SIS, ISO 20816-1:2016
- ISO 10816 zones explained: Satotech, ISO 10816 vibration criteria and Zones A–D (Japanese)
- Bearing defect frequencies: Satotech, "What are bearing fault frequencies?" (Japanese)
- Merger into ISO 20816 and evaluation criteria: Shinkawa Electric, rotating machine vibration and condition monitoring, Part 2 (Japanese)
- JIS B 0906:1998 and its correspondence to ISO 10816-1:1995: JIS B 0906:1998 text (Japanese)
- JSME vibration analyst certification (ISO 18436-2): JSME, machine condition monitoring certification (Japanese)
Original article in JapaneseThis guide is adapted from a MONOSCOPE article written for readers in Japan: 設備の振動診断入門|測定点・判定基準・異常パターンの見方
About the editor
 MONOSCOPE EditorFOUNDER & EDITOR
Spent about ten years at a plant equipment maker and a plant engineering company, proposing, designing, and commissioning equipment, then moved into web marketing. Now a web consultant for B2B manufacturers, helping them explain their products and technology. Licensed in Japan as an Energy Manager and a Third-Class Chief Electrical Engineer.
Has run an engineering blog since 2017 (500+ articles) and a Japanese YouTube channel with about 20,000 subscribers. Each English guide is written from the Japanese shop-floor point of view and checked against the cited standards.