AIAG-VDA FMEA for Japanese Customers: DFMEA vs PFMEA
Your Japanese customer sends a list of documents it needs before it will approve mass production. The list includes a DFMEA, a PFMEA, a QC process chart, and maybe a DRBFM for a design change. Then come the questions. Should the FMEA follow the AIAG & VDA format or the older AIAG 4th edition? Do they still want an RPN? Is a DRBFM the same thing as an FMEA? And what will their quality engineers look for when they open your file?
This guide answers those questions. It covers what an FMEA (failure mode and effects analysis) is, how a design FMEA (DFMEA) differs from a process FMEA (PFMEA), and the seven steps of the AIAG & VDA FMEA Handbook. It also explains how Action Priority (AP) replaced the risk priority number (RPN), walks through a filled-in PFMEA example (fictional), and ends with a pre-submission checklist and a list of questions to ask your Japanese customer.
- FMEA finds the ways a product or process can fail before it happens and ranks the actions. IATF 16949 requires it for both product design and manufacturing process design.
- A DFMEA asks "Will this design work?" A PFMEA asks "Can this process build the part to the drawing?"
- The AIAG & VDA FMEA Handbook (2019) runs every FMEA in seven steps and analyzes structure, function, and failures before rating anything.
- Action Priority (H, M, L) replaced RPN and weights severity most heavily. Older FMEAs and some customers still use RPN, so ask which format your customer wants.
- Japanese customers tend to check whether the PFMEA, QC process chart, and work instructions agree, whether causes stop at "operator error," and whether the FMEA was updated after defects.
Contents
- What Is FMEA?
- DFMEA vs. PFMEA
- What Japanese Customers Expect From Your FMEA
- The 7 Steps of an AIAG & VDA FMEA
- From RPN to Action Priority
- PFMEA Example: Bolt Fastening (Fictional)
- Common FMEA Mistakes
- Checklist: Before You Submit an FMEA to a Japanese Customer
- Questions to Ask Your Japanese Customer
- Limits of This Guide
- FAQ
- Sources
What Is FMEA?
FMEA stands for failure mode and effects analysis. The team lists how each part of a product or process could fail, traces what each failure would cause and why it would happen, and then decides which risks need action first.
A failure mode is the way an item fails: an open circuit, a short, a fracture, wear, or drift in a characteristic. JIS C 5750-4-3, Japan's FMEA procedure standard (its international counterpart is IEC 60812), defines it as the manner in which an item fails. The point is to write how the item fails, not why. The cause goes in a separate column.
The method is old. It goes back to MIL-P-1629, a US military procedure issued in 1949. NASA's Apollo program and other aerospace work used it in the 1960s, and the auto industry took it up later. Today IATF 16949, the automotive quality management standard, requires FMEA as an output of both product design and manufacturing process design. That requirement is a common reason an automotive customer, Japanese or otherwise, asks for one.
FMEA vs. FTA
FMEA is often mentioned alongside FTA (fault tree analysis). FMEA works bottom up: it starts from a part or an operation and asks what happens higher up if that element fails. FTA works top down: it puts an unwanted event at the top and breaks it down into causes.
They start from opposite ends, so each suits different jobs.
JIS C 5750-4-3:2011 notes that FMEA has trouble showing how failure modes interact, and it positions FTA as a supplement. A simple split: use FMEA to cover everything, and FTA to trace the combination of causes behind one specific, serious event.
DFMEA vs. PFMEA
FMEAs come in two main types. A DFMEA (design FMEA) covers the design. A PFMEA (process FMEA) covers the manufacturing process. Both follow the same steps, but they break down different things and describe causes at different levels of detail.
A DFMEA looks for weak points in the design before the drawings are released. Causes are things the design decides: material choice, tolerances, clearances between parts, and resistance to the operating environment. Teams usually run it together with design reviews (DR, called sekkei shinsa in Japanese), from concept design through detailed design.
A PFMEA looks for defects the process could create, before mass production starts. The question is whether the plant can build the part to the drawing, so it assumes the design is correct. Manufacturing engineering runs it alongside process design and equipment specification. Its results go into the control plan (in Japanese plants, often a QC kotei-hyo, or QC process chart, which covers much the same ground) and the work instructions.
Same seven steps, but a different breakdown and different kinds of causes.
A PFMEA assumes the design is correct. Problems caused by the design go back to the DFMEA.

What Japanese Customers Expect From Your FMEA
The method is international, but the questions suppliers to Japanese companies run into are fairly specific. Three come up most often: which format to use, how FMEA relates to DRBFM, and what the customer checks when you submit.
Which Format: AIAG & VDA or AIAG 4th Edition?
There is no single answer for "Japanese customers." Before 2019, suppliers to North American automakers used the AIAG FMEA manual, 4th edition (2008), and suppliers to German automakers used VDA Volume 4. The AIAG & VDA FMEA Handbook, published in 2019, merged the two.
For Japanese automakers, the clearest public statement we found comes from Honda North America. In AIAG's December 2019 announcement of OEM deployment plans, Honda North America said it would accept AIAG & VDA FMEAs immediately. It also estimated that suppliers would have to use the handbook for new processes, new lines, and new parts from around February 1, 2022, and that all PFMEAs should be in the new format by January 2027. We did not find a comparable public statement from Toyota or Nissan.
Two more facts shape what you will see in practice. The 2019 OEM announcements said suppliers did not have to convert existing FMEAs, so many older FMEAs in the RPN-based 4th-edition format are still in use. Outside the auto industry, Japanese companies may refer to JIS C 5750-4-3 (IEC 60812) instead of the AIAG & VDA handbook. The practical answer is to ask each customer which format and which rating tables it requires, and to check its customer-specific requirements (CSRs) if it is an IATF 16949 customer.
FMEA vs. DRBFM: When Japanese Customers Ask for Which
When you change a proven design, a customer in a Japanese automotive supply chain may ask for a DRBFM (Design Review Based on Failure Mode) instead of, or in addition to, an updated FMEA. DRBFM originated at Toyota and focuses only on what changed and what the change affects. An FMEA covers the whole design or process. A workable split: use FMEA to cover new design content thoroughly, and DRBFM to focus on changes to carryover designs. SAE J2886 states that DRBFM is not meant to replace FMEA, so a customer may ask for both. For the worksheet, a filled-in example, and how the review meeting runs, see our guide to DRBFM vs. FMEA.
What Customers Check When You Submit
Japanese quality engineers rarely stop at whether the form is complete. The points below come up repeatedly in customer audits and in the review of FMEAs submitted before mass production:
- Consistency across documents. Every key control in the PFMEA should appear in the control plan or QC process chart and in the work instructions. Customer audits often check this.
- Causes that stop at "operator error." A cause like "operator mistake" with "retrain the operator" as the action is a common reason for pushback. The customer expects the cause traced to the method, fixture, or layout that let the mistake happen.
- Prevention before detection. Adding inspection lowers the detection rating but leaves occurrence unchanged. Customers prefer actions that stop the cause.
- A cross-functional team. An FMEA written by one person shows only what that person knows.
- Updates after defects and changes. When a defect reaches the customer, the corrective action is expected to include an FMEA review. If the FMEA never anticipated that cause, the gap itself is one of the system causes. See our guide to writing an 8D report.
Where FMEA sits in the wider quality workflow of a Japanese plant, from the quality plan to complaint handling, is covered in Quality Assurance Process at Japanese Plants.
The 7 Steps of an AIAG & VDA FMEA
The AIAG & VDA handbook runs every FMEA in seven steps. With the older AIAG 4th edition, teams often filled in the form column by column from left to right. The new approach adds three explicit analysis steps (structure, function, and failure) before anyone assigns a rating.
The analysis steps build the foundation; the later steps rate the risks and act on them.
DFMEA and PFMEA use the same seven steps. FMEA-MSR (monitoring and system response) uses the same framework.
Step 1: Planning and Preparation
Decide what you will analyze, by when, with whom, and with what tools. The handbook groups these as the 5Ts: InTent (purpose), Timing, Team, Task (work to be done), and Tools. Timing is especially important. FMEA is a preventive activity, not paperwork after the fact. An FMEA rushed together just before mass production leaves no room to change the design or the equipment.
Set the scope as well. Put new design content, changes, and new operating conditions first, and refer to existing FMEAs for carryover content to save effort. Build the team across functions: design, manufacturing engineering, quality assurance, and production.
Step 2: Structure Analysis
Break the subject into a hierarchy. The key idea is the focus element: the element you are analyzing sits in the middle, and you look at it together with the level directly above and the level directly below.
In a DFMEA, the levels are system, subsystem, and component. In a PFMEA, the top level is the process item (usually the product or the line), the middle is the process step (an operation such as fastening, welding, or inspection), and the bottom is the process work element. Work elements are normally listed under the 4Ms: Man, Machine, Material (indirect materials), and EnvironMent.
The process step sits in the middle, with the product above and the 4Ms below.
In the AIAG & VDA approach, Material means indirect materials, not the part being processed. Some companies use 5M or 6M instead of 4M.
Do not think about failures yet. Build a complete map from the process flow diagram or bill of materials first. How complete this map is decides how complete the later steps will be.
Step 3: Function Analysis
Write a function and its requirements for each element in the tree. Write functions as verb plus object, and requirements as measurable characteristics such as torque, dimensions, or cleanliness.
In the fastening example, the process step's function is "Tighten the bolt to the specified torque of 25 N·m" (an illustrative value). The nutrunner's function is "Stop tightening when the set torque is reached." Link each higher-level function to the lower-level functions that support it, and the failure analysis almost builds itself.
Step 4: Failure Analysis
Describe how each function can fail, using three terms. What goes wrong at the focus element is the failure mode (FM). What it causes at the level above is the failure effect (FE). What lies in the work element below is the failure cause (FC). Linked together, the three form a failure chain.
The three levels of the structure tree map directly to cause, mode, and effect.
Look at effects from three viewpoints to avoid gaps: your own next operation, the customer's assembly plant, and the end user. To find causes, it helps to draw a fishbone (cause-and-effect) diagram organized by the 4Ms and then transfer the causes to the FMEA.
Step 5: Risk Analysis
For each failure chain, record the current controls and rate three indicators from 1 to 10:
- Severity (S): how serious the failure effect is
- Occurrence (O): how likely the cause is, given the prevention controls
- Detection (D): how well the detection controls catch the failure before it escapes to the next operation or the customer. The easier it is to detect, the lower the number.
Record two kinds of control separately. Prevention controls keep the cause from happening, such as a tool that stops automatically at torque, or training on the work standard. Detection controls find the failure after it happens, such as monitoring the tightening-complete signal or 100% inspection. In a PFMEA, automated inspection, including AI-based visual inspection, also counts as a detection control.
Look up the S, O, D combination in the AP table to get a priority of H (high), M (medium), or L (low). To keep ratings consistent between people, add product- and process-specific descriptions to the handbook's rating tables.
Step 6: Optimization
Decide actions for chains rated H or M. Give every action an owner and a due date, check its effect after it is done, and re-rate S, O, and D. Choose actions in this order:
- Change the design or process to remove the cause
- Make the cause less likely with prevention controls
- Catch the failure with detection controls
Adding inspection lowers D but leaves O unchanged. The AIAG & VDA approach puts preventing the cause ahead of detecting the failure. Severity drops only if a design change alters the failure effect itself.
Step 7: Results Documentation
Summarize the scope, the risks found, the actions taken, and their effect, and share the summary with the relevant departments and the customer. Carry key controls from the PFMEA into the control plan and work instructions, and DFMEA results into the design verification plan and the special characteristics on the drawing.
An FMEA is a living document. Review it after design changes, process changes, and any defect found in the plant or in the field.
From RPN to Action Priority
AIAG, the US automotive industry group, and VDA, the German Association of the Automotive Industry, published the joint handbook in 2019. It replaces both the AIAG 4th edition (2008) and VDA Volume 4, which had given suppliers different forms and logic depending on the customer. Suppliers to North American and German automakers are increasingly asked to submit FMEAs in this format. In auto supply chains, the same expectations can reach Tier 2 suppliers and below, not only Tier 1.
The bigger change is the order of thinking and how priority is set, not the form.
FMEA-MSR (monitoring and system response) is a supplementary FMEA. It rates whether the vehicle can detect a failure in use and keep a safe state, using severity, frequency, and monitoring.
What Was Wrong With RPN
Because RPN multiplies S, O, and D, very different risks can produce the same number or rank in the wrong order. S=10, O=4, D=4 gives an RPN of 160. S=4, O=7, D=7 gives 196. Ranked by RPN, the second wins, yet the first is a serious failure that affects customer safety.
Thresholds such as "act on anything with RPN of 100 or more" also tempt teams to adjust ratings until they fall below the line. AP addresses both problems with a table that weights severity most heavily, then occurrence, then detection.
AP is not a risk score. It tells you how urgently action is needed.
AP results follow the AP table in the AIAG & VDA FMEA Handbook. Always confirm against the table version your company or customer specifies.
PFMEA Example: Bolt Fastening (Fictional)
Here is the bolt fastening operation from Figures 4 and 5, carried through to actions. One failure mode, "tightening torque below specification," has two failure chains with different causes. The ratings are fictional and for illustration only.
Same failure mode, different causes, so the controls and ratings differ too.
Fictional values for illustration. AP is looked up in the AIAG & VDA AP table.
In chain A, the action does not stop at "tell the operator to be careful." The fixture physically prevents the part from moving on. In chain B, the feed method makes it hard to load the wrong bolt, and a sensor adds detection. Both lower occurrence without relying on the operator's attention.
After the actions, add controls such as "monitor tightening-complete signal" and "daily check of bolt length sensor" to the control plan. Customer audits often check that the PFMEA, control plan, and work instructions say the same thing.

Common FMEA Mistakes
FMEAs tend to fail in how they are used, not in the method itself. Four mistakes come up again and again.
Copying an Old FMEA
Reusing the FMEA of a similar product saves time, but copying it whole without listing the changes misses the new risks. Start by listing what changed: material, geometry, process sequence, equipment, and operating environment. Focus the analysis there.
Writing It Alone
An FMEA filled in by one person contains only the failures that person knows about. Designers often do not know the quirks of the process, and manufacturing engineers often do not know how customers use the product. Hold at least one cross-functional session to review the structure and the failure chains.
Mixing Up Failure Modes and Causes
Writing "operator error" as a failure mode is a common mix-up. Use the structure tree to sort them: the failure mode is what happens at the focus element, and the cause lies in the work element below it. If a cause still feels too broad, dig one level deeper with why-why analysis, the 5 Whys approach from the Toyota Production System. See our 5 Whys example.
Not Updating It After Launch
In-process defects or field complaints appear after launch, yet the FMEA often stays unchanged. Build a check into your corrective action procedure: was this failure chain in the FMEA, and were its ratings realistic? That keeps the FMEA in line with reality.
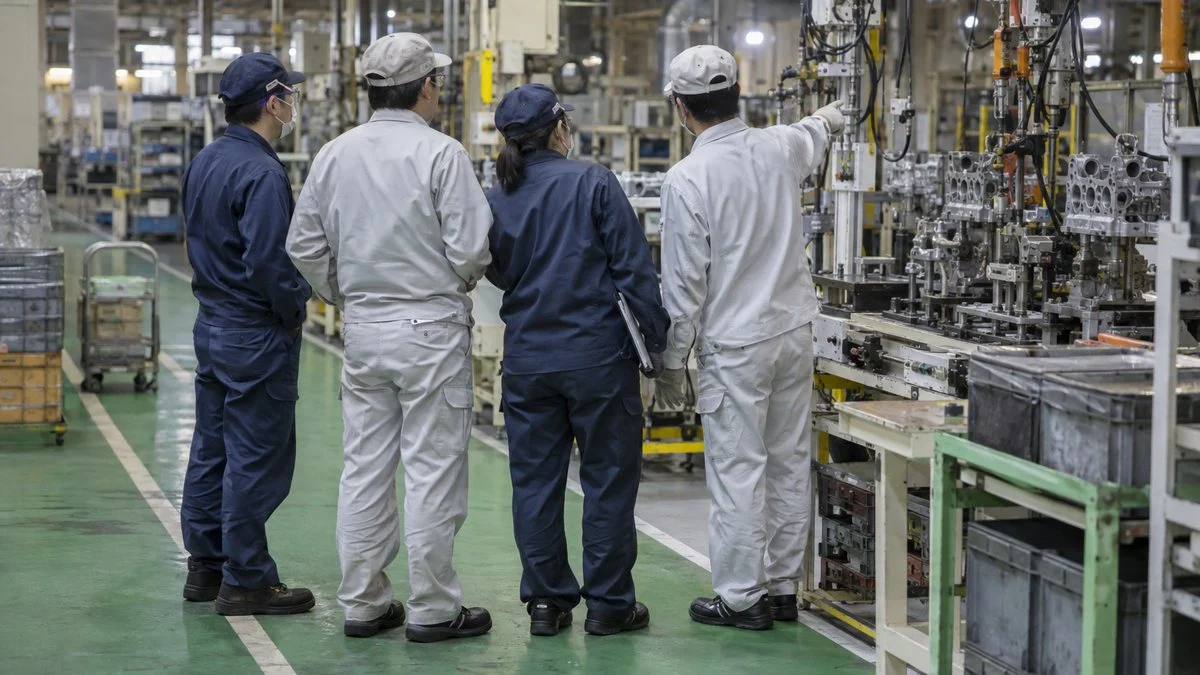
FMEA is not a job for quality assurance alone. It works only when design, manufacturing engineering, and production each bring what they know, and the automotive industry is where suppliers meet it most often.
Checklist: Before You Submit an FMEA to a Japanese Customer
- Format and rating tables confirmed with the customer (AIAG & VDA with AP, AIAG 4th edition with RPN, or the customer's own form)
- Customer-specific requirements (CSRs) and any customer FMEA template checked
- Scope stated: which parts, processes, and changes are covered, and which existing FMEAs are referenced for carryover content
- Structure tree complete and matched to the process flow diagram or bill of materials
- Functions written as verb plus object, with measurable requirements
- Failure modes, effects, and causes in the correct columns, with no "operator error" left as the final cause
- Effects considered for your next operation, the customer's plant, and the end user
- Prevention and detection controls recorded separately
- Every H item has an action or a documented reason why current controls are adequate; M items have an action or a recorded reason
- Every action has a named owner, a due date, and re-rated S, O, D after completion
- Special characteristics on the drawing reflected in the DFMEA and PFMEA
- PFMEA controls match the control plan or QC process chart and the work instructions
- Team members from at least design, manufacturing engineering, quality assurance, and production listed
- Revision history showing updates after design changes, process changes, and defects
- DRBFM prepared as well if the customer asked for one on a design change
Questions to Ask Your Japanese Customer
- Which FMEA format do you require: AIAG & VDA (AP) or AIAG 4th edition (RPN)? Do you have a template?
- Which version of the rating tables and AP table should we use? Do you have your own severity criteria?
- Do you need the DFMEA, the PFMEA, or both? For which part numbers?
- For this design change, do you want a DRBFM, an updated FMEA, or both? How should the two be linked?
- Will you review the FMEA, or only receive it? When is it due relative to the mass production decision?
- Must the PFMEA match a specific control plan or QC process chart format?
- Do our existing RPN-based FMEAs need converting, or only new parts and processes?
- Do you require the FMEA to be updated as part of every 8D or corrective action report?
A short email you can adapt:
Subject: FMEA format for [part number] PPAP / mass production approval
Thank you for the document list for [part number]. Before we start the DFMEA and PFMEA, could you confirm the following?
1. Format: AIAG & VDA (Action Priority) or AIAG 4th edition (RPN)? Please send your template if you have one.
2. Rating tables: should we use the AIAG & VDA tables as published, or your own severity criteria?
3. For the change from [old design] to [new design], do you also need a DRBFM?
4. Due date, and whether you will review the FMEA in a meeting.
Best regards,
Limits of This Guide
- OEM deployment dates come from AIAG's December 2019 announcement. Plans may have changed since then. Check the current customer-specific requirements of each automaker.
- We found no public statement of Toyota's or Nissan's FMEA format requirements. Requirements also differ between a Japanese automaker's plants in Japan, North America, and Asia, and between automakers and Tier 1 suppliers.
- This guide follows the AIAG & VDA handbook for the automotive industry. Other industries may use JIS C 5750-4-3 (IEC 60812) or their own methods.
- The PFMEA example is fictional. Use your own rating tables and your customer's AP table when you rate real risks.
FAQ
What Is the Difference Between DFMEA and PFMEA?
A DFMEA analyzes whether a design will perform its function and is done before drawing release. A PFMEA analyzes whether the manufacturing process can build the part to the drawing and is done before mass production. A PFMEA assumes the design is correct.
Is RPN Still Used in AIAG & VDA FMEA?
No. The AIAG & VDA handbook replaced RPN with Action Priority (H, M, L), which weights severity first, then occurrence, then detection. Older FMEAs in the AIAG 4th-edition format still use RPN, so ask your customer which method it wants.
What Are the 7 Steps of FMEA?
Planning and preparation, structure analysis, function analysis, failure analysis, risk analysis, optimization, and results documentation. DFMEA and PFMEA follow the same seven steps.
Do Japanese Automakers Require AIAG & VDA FMEA?
It depends on the customer. Honda North America announced a plan to require it for new processes and parts from around 2022 and for all PFMEAs by January 2027. We found no comparable public statement from other Japanese automakers. Ask your customer and check its customer-specific requirements.
Is DRBFM a Replacement for FMEA?
No. DRBFM focuses on changes to a proven design, while FMEA covers the whole design or process. SAE J2886 states that DRBFM is not intended to replace FMEA. Japanese customers may ask for both.
Sources
- OEM deployment plans, including Honda North America: AIAG, "AIAG Announces OEM Deployment Plan for New AIAG-VDA FMEA Handbook" (December 11, 2019)
- Handbook overview: AIAG, "AIAG & VDA FMEA Handbook"
- Seven steps, publication, failure chain: Quality Digest, "Understanding AIAG-VDA's FMEA Process and Approach"
- 5Ts, AP levels, FMEA-MSR, changes from the 4th edition: Quality-One, "AIAG & VDA FMEA"
- RPN to AP and the 4th edition date: Techno-con, "Overview of the AIAG & VDA FMEA Handbook" (Japanese)
- Structure, function, and failure analysis steps: KKE, "A More Robust FMEA in 7 Steps" (Japanese)
- PFMEA structure tree and 4M: THORS, "The AIAG & VDA Recommendation to PFMEA Seven-Step Approach"; Pretesh Biswas, "AIAG & VDA Process Failure Mode and Effect Analysis"
- AP table: Relyence, "FMEA AP (Action Priority)"
- AP weighting: QSA Hub, "AIAG-VDA FMEA: The 7-Step Standard Explained"
- Failure mode definition, limits of FMEA, and the role of FTA: JIS C 5750-4-3:2011 (Japanese); Japanese Standards Association, JIS C 5750-4-3:2021 (Japanese)
- History (MIL-P-1629, Apollo): UK Ministry of Defence ASEMS, "FMEA/FMECA"
- DFMEA and PFMEA roles, FMEA vs. FTA: KKE, "What Is FMEA?" (Japanese)
- IATF 16949 clauses 8.3.5.1 and 8.3.5.2: IATF16949 Kouryaku, "8.3.5.1 Design and development outputs" (Japanese); "8.3.5.2 Manufacturing process design output" (Japanese)
- DRBFM, SAE J2886, AIAG CQI-24: see the sources in our DRBFM guide
Original article in JapaneseThis guide is adapted from a MONOSCOPE article written for readers in Japan: FMEAのやり方|DFMEA・PFMEAの7ステップとAIAG-VDA版の変更点
About the editor
 MONOSCOPE EditorFOUNDER & EDITOR
Spent about ten years at a plant equipment maker and a plant engineering company, proposing, designing, and commissioning equipment, then moved into web marketing. Now a web consultant for B2B manufacturers, helping them explain their products and technology. Licensed in Japan as an Energy Manager and a Third-Class Chief Electrical Engineer.
Has run an engineering blog since 2017 (500+ articles) and a Japanese YouTube channel with about 20,000 subscribers. Each English guide is written from the Japanese shop-floor point of view and checked against the cited standards.