OEE and the 7 Big Losses vs. Six Big Losses in TPM
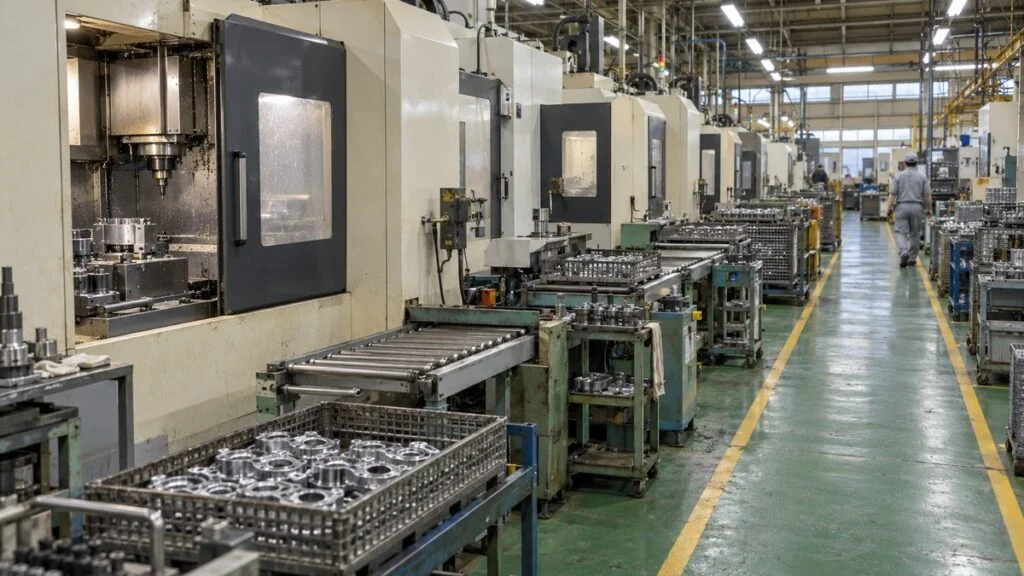
Your plant has fixed the worst breakdowns and shortened changeovers, yet the OEE number on the monthly report barely moves. Or the Japanese parent company sends a dashboard built on the "7 big losses," while your own training material lists the Six Big Losses, and nobody is sure the two plants count the same things.
Overall equipment effectiveness (OEE) shows how much of the time a machine was scheduled to run actually went into making good parts. When it stays flat despite real work on the floor, the cause is usually not the equipment alone. Check three things: whether the number reflects what really happens, whether you are attacking the losses that matter, and whether fixes and follow-up checks keep going.
This guide walks through the OEE formula as Japanese plants use it, how the Japanese 7 big losses (nana-dai rosu) differ from the Six Big Losses common in English sources, the three reasons OEE stalls, a five-step improvement process, and a checklist and question list you can use with a Japanese plant. One fictional line runs through all the worked examples so you can follow the diagnosis from start to finish.
Contents
- OEE Not Improving? Three Things to Check First
- How OEE Is Calculated in Japanese Plants
- The 7 Big Losses vs. the Six Big Losses
- Cause 1: The Number Does Not Reflect Reality
- Cause 2: The Work Misses the Losses That Matter
- Cause 3: Nothing Keeps Improvement Going
- Five Steps to Improve OEE
- Limits of OEE as a Metric
- Checklist: Before You Compare OEE with a Japanese Plant
- Where This Guide Does Not Apply
- FAQ
- Sources
OEE Not Improving? Three Things to Check First
The reasons OEE stalls fall into three broad groups: the number does not reflect reality, the work is aimed at the wrong losses, or nothing keeps the improvement cycle running. Each one points to different data, so start with the symptom closest to what you see.
Pick the symptom closest to yours, then look at the data and section listed.
More than one cause can apply at the same time. If so, start with Cause 1 so the later analysis rests on stable numbers.
Check the measurement first. If the basis of the number is inconsistent, you cannot tell which loss is largest or whether a fix worked.
How OEE Is Calculated in Japanese Plants

In Japanese, OEE is setsubi sogo koritsu (設備総合効率). English sources almost always expand OEE as overall equipment effectiveness. Japanese Industrial Standard JIS Z 8141:2022 (production management terms) and the Japan Institute of Plant Maintenance (JIPM) use "overall equipment efficiency" instead. Both refer to the same metric, which JIS defines as an indicator of how efficiently equipment is used.
The Three Factors and the Formula
A note in JIS Z 8141 splits the losses that reduce equipment efficiency into three groups: stoppage losses, performance losses, and defect losses. Each group is measured by one rate, and OEE is the product of the three.
OEE = availability × performance × quality rate
For machining and assembly equipment, the factors are usually calculated as follows. JIPM, which proposed TPM (total productive maintenance) in 1971, uses the same availability definition and notes that OEE can also be calculated as ideal cycle time × good count ÷ loading time.
- Availability (jikan kadoritsu) = operating time ÷ loading time
- Performance (seino kadoritsu) = ideal cycle time × total count ÷ operating time
- Quality rate (ryohinritsu) = good count ÷ total count
Loading time (fuka jikan) is the time the equipment is planned to run: total working time minus planned stops such as breaks and planned maintenance. English sources often call this planned production time. Ideal cycle time (kijun saikuru taimu) is the time needed to make one part when nothing goes wrong.
Process industries define the three factors differently, so this guide assumes machining and assembly equipment.
OEE as a Breakdown of Time
The three-factor product is easier to read as time. Subtract the three types of loss from loading time, one after another, and OEE is the share left over: the time spent making good parts.
Three types of loss cut into the planned time, one after another.
OEE = 312 min fully productive time ÷ 460 min loading time = 67.8%
Fictional numbers for illustration. Net operating time and fully productive time are calculated from output and ideal cycle time, not measured with a stopwatch.
Note that the chart mixes two kinds of time. Stoppage losses are real clock time when the machine stood still. Performance and defect losses are back-calculated: how many minutes the output would have taken at the ideal cycle time.
Worked Example
The line in Figure 2 has a 480-minute shift with 20 minutes of morning meeting and breaks, so loading time is 460 minutes. It stopped for 25 minutes of breakdowns and 35 minutes of changeovers, leaving 400 minutes of operating time.
The ideal cycle time is 30 seconds (0.5 min). The line made 640 parts, 16 of them defective. Availability is 87.0%, performance 80.0%, and quality rate 97.5%, so OEE is 67.8%.
Each factor looks like 80–90% or more, but the product falls below 70%.
Fictional numbers for illustration.
The rest of this guide uses the same line to decide where to start on the 148 lost minutes.
The 7 Big Losses vs. the Six Big Losses
JIS Z 8141 lists the "7 big losses of equipment" (setsubi no nana-dai rosu) that drag OEE down: breakdowns, setup and adjustment, cutting tool change, startup, minor stops and idling, reduced speed, and defects and rework.
A minor stop is choko-tei (チョコ停) in Japanese shop-floor language: a short stop caused by a jammed part, a false sensor signal, and the like. Keyence describes it as a stop that takes a few minutes to recover from and needs no part replacement or repair.
Knowing which loss hits which factor lets you trace a weak number back to its cause.
Some sources put startup loss under quality rate, focusing on the defects made during startup. Decide where it goes and apply the rule on every line.
Most English sources teach the Six Big Losses instead, a list usually traced to Seiichi Nakajima's Introduction to TPM (English edition, Productivity Press, 1988). Some Japanese sources also speak of "6 big losses." The differences are small but show up as soon as two plants compare data.
The same events, sorted a little differently.
English-side breakdown based on Vorne Industries (OEE.com). Consultants and companies use their own variants on both sides.
Whichever list you use, the structure is the same: stoppage, performance, and defect losses. The practical risk is in the details. If a Japanese plant counts tool changes as their own loss and your plant files them under setup, the two Pareto charts will not line up even when the machines behave the same.
Larger lists also exist. A TPM guide from JMA Consultants (JMAC) describes 8 equipment losses, which add shutdown loss (time lost to planned shutdowns) to the seven, as part of a broader set of 16 big losses that also covers people and material and energy use. If a Japanese report mentions 8 or 16 losses, ask which list it follows.
Rules for Logging Losses Without Gaps or Double Counting
Knowing the names is not enough. If one person logs a stop as a breakdown and another logs the same kind of stop as a minor stop, the records will not match. The standard does not draw every boundary, so each company has to decide these points:
- Minor stop vs. breakdown: how many minutes of stop count as a minor stop, and whether repair work is involved
- End of setup: when the last adjustment is done, or when the first good part comes out
- Defects during startup: counted as defect loss or as startup loss
- Stops not caused by the equipment, such as waiting for material or instructions: where they are filed
As a rule of thumb, the JMAC guide says a stop is commonly treated as a breakdown when repair takes 5–10 minutes or more, and minor stops are generally 5 minutes or less. Set the threshold to suit your equipment, then apply the same rule on every production line.
Cause 1: The Number Does Not Reflect Reality

The first cause is an OEE figure that does not match what happens on the floor. Fixes chosen from a distorted number miss the real losses, so check these four common distortions before anything else.
Loading Time Is Defined Differently
Loading time, the denominator of availability, changes with what you subtract as planned stops. If setups, cleaning, or waiting for material are treated as planned stops, the machine is standing still but availability does not drop.
If each line or each month handles this differently, the numbers cannot be compared. List the items that may be subtracted as planned stops. Everything not on that list stays inside the OEE calculation and is classified by each loss's own rule: minor stops, for example, count as a performance loss, not an availability loss.
Short Stops Never Reach the Log
When operators record stops by hand in a daily report, stops lasting tens of seconds to a few minutes rarely get written down. The operator clears the problem and moves on.
Japan's Information-technology Promotion Agency (IPA) has published a case study of Asahi Tekko, an auto parts maker. According to the article, manual records miss short stops and estimate times by feel, so stop time is recorded about 20% shorter than it really is. That figure comes from one company's experience, but any plant that relies on handwritten logs should check for the same gap.
The Ideal Cycle Time Is Old or Loose
Performance depends heavily on the ideal cycle time you set. If the standard includes slack, performance stays near 100% even when the machine runs slow, and the loss disappears from view.
The IPA case study also notes that cycle times are often not known accurately, and where they are known, they are often old values measured when the line was installed. Check when, and under what conditions, the standard was set, and compare it with current equipment specs and actual capability.
Reworked Parts Count as Good
Counting reworked parts as good inflates the quality rate. Rework is part of the defects-and-rework loss, so the good count in OEE should normally be first-pass good parts only.
Confirm these four points before you start fixing anything.
Fixing the definitions can make OEE drop. The equipment has not gotten worse; the losses have become visible.
After a definition change, the new numbers no longer connect with past months. In reports, show old-basis and new-basis figures side by side for a while. That separates the change caused by measurement from the change caused by real improvement.
Cause 2: The Work Misses the Losses That Matter
The second cause is a gap between what you are fixing and the losses that actually pull OEE down. Once the measurement is consistent, review which losses to work on.
Factors and Production Conditions Are Not Compared
If you track only the overall number, you will not notice when another change cancels out an improvement. Suppose the example line cut breakdown time from 25 to 10 minutes.
During the same period, new products were added and changeovers rose from two to three a day, so setup time grew from 35 to 50 minutes. Total stoppage loss stays at 60 minutes, and OEE stays at 67.8% even though the breakdown fix worked.
The reason shows up only when you put the factors and production conditions side by side.
Fictional numbers for illustration. In this case the next target is setup time, not breakdowns.
In monthly comparisons, put production conditions (number of products, changeovers, output volume, and staffing) next to the three factors. When conditions change, convert losses to a per-changeover or per-part basis before comparing.
Stop Reasons Pile Up Under "Other"
When the list of stop reasons is too coarse, most entries end up as "other" or "equipment problem," and nobody knows where to look next. Break the reasons down to a level where the person responsible for the fix can act.
A Pareto chart, one of the seven basic QC tools, works well here: sort stops by total time and dig into the top two or three items.
Minor Stops and Reduced Speed Are Lumped Together
The largest loss in the example is the 80 minutes of performance loss. Because that figure is back-calculated from output, it does not tell you how much is minor stops and how much is slow running. Separating them takes extra measurement.
Say you measure the actual cycle time and count stops for a few days, and the line actually runs at 33 seconds per part. Over 640 parts, that adds 32 minutes beyond the ideal: the reduced-speed loss. The remaining 48 minutes are minor stops, the equivalent of 24 stops of 2 minutes each.
Split into five, the 148 lost minutes show minor stops as the largest loss.
Fictional numbers for illustration. Minor stops and reduced speed were separated by measuring actual cycle time and stop count. Defect loss is 16 parts × 0.5 min ideal cycle time.
Each short stop looks cheap, but they add up. Keyence gives an example: a machine makes parts worth JPY 5 each at 100 parts per minute, and a 5-minute minor stop happens once an hour. Running 24 hours a day, 365 days a year, each stop costs JPY 2,500, which is JPY 60,000 a day and JPY 21.9 million a year (Keyence rounds this to nearly JPY 22 million).
Targets Are Picked by Size Alone
The largest loss is not always the first one to tackle, and you will not eliminate all 48 minutes of minor stops. Choose targets on three points:
- Production need: is this machine's output short of orders or of what the next process needs?
- Recoverable amount: can the cause be identified, and how much can realistic fixes remove?
- Cost of the fix: money, downtime, and people required
Among the large losses, pick one with a single clear cause that you can test quickly. That gets you to a verified result sooner.
Cause 3: Nothing Keeps Improvement Going

The third cause is how the work is run. Even with the right measurement and the right targets, improvement does not stick if fixes stall halfway or the team moves on without checking results.
Fixes usually stall for three reasons. The numbers are reviewed once a month, so nobody remembers what happened on the day of the problem. Actions have no owner or deadline. And nobody checks the numbers after the fix.
Review Yesterday's Data This Morning
At Asahi Tekko, as described in the IPA case study, operators, supervisors, and production engineers meet on the floor at a set time every day. In this "line stop meeting," they use the previous day's operating data to review problems and results, then decide what to do next and by when.
The reason for meeting daily: operators can explain yesterday's problems in detail, but a week later the details are gone. The data comes first, then a look at the actual machine and parts.
By focusing on stops and slow cycle times, the company raised productivity by an average of 43% across 100 production lines from 2015 to 2018, according to the IPA article. Productivity here means output per line-hour, not OEE itself. The article also cites labor cost savings of more than JPY 400 million a year by 2021, compared with 2015, and getting more out of existing lines helped the company avoid adding equipment.
Keep Data Collection Light for the Floor
If operators must write a detailed reason for every stop, record-keeping becomes a burden and accuracy drops. A practical split: capture stop time and output automatically from equipment signals, and ask people only to choose the reason.
Tools for automatic collection include an MES (manufacturing execution system) or retrofit sensors that pick up run signals from older machines (see retrofit machine monitoring on older Japanese machines). Tools alone change nothing, though. Results come only when someone looks at the numbers and decides on actions.
Equally important: do not use the numbers to blame people. If the lines that log stops honestly end up looking worst, the records will drift away from reality.
Five Steps to Improve OEE
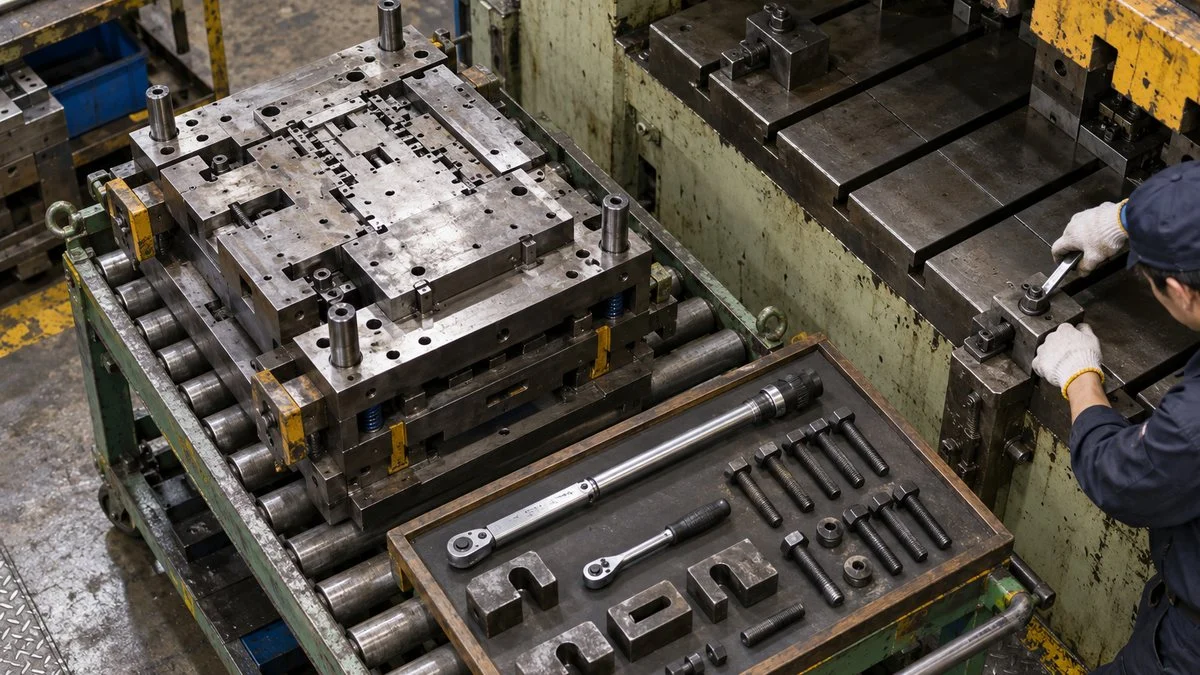
Putting the three causes together gives a five-step process. The core idea: narrow down to one target, verify the result in numbers, then move to the next.
Fix the measurement first, then narrow the target, act, and verify.
Skip Step 01, and in Step 04 you will not be able to compare before and after.
Typical Fixes by Loss Type
In Step 04, the right people and methods depend on the loss:
- Breakdowns: record the failed part and the cause, and review inspection and replacement intervals. For critical equipment, consider condition monitoring
- Setup and adjustment: move preparation that can be done while the machine runs to before the stop, and cut repeat adjustments
- Minor stops: look at the machine at the moment it stops. Check cleaning, lubrication, sensor position and sensitivity, and part orientation
- Reduced speed: ask why the speed was turned down (defects, vibration, fear of jams) and remove that cause first
- Defects and rework: stratify defects by type and narrow down the process and conditions where they occur
For breakdowns, the question is how to balance time-based replacement and condition-based monitoring; the guide to hozen (equipment maintenance) types in Japanese plants covers TBM, CBM, and where TPM fits. For machines that show early warning signs, consider predictive maintenance.
Related: Predictive Maintenance ROI: How Japanese Plants Justify It
For setups, the basic move is external setup (soto-dandori): doing the preparation before the machine stops instead of while it stands idle. Minor stops become chronic if operators just restart the machine without finding the cause, so dig into each one with why-why analysis.
With reduced speed, keep two jobs apart: checking the ideal cycle time and fixing real slow running. If the standard is loose, fix the standard. If the standard is sound and the line is still slow, fix the equipment or the conditions.
Daily care such as cleaning, lubrication, and retightening belongs to jishu hozen (autonomous maintenance), where operators look after their own machines. Minor stops and reduced speed often start when these basic conditions slip.
Limits of OEE as a Metric
Keep three points in mind about OEE itself.
Do Not Fixate on the 85% Benchmark
An OEE target of around 85% is often quoted, and it is a high bar. Even 90% availability, 95% performance, and 99% quality rate multiply out to only 84.6%.
What is achievable also depends on the product mix, changeover frequency, and type of equipment, and the number shifts with how you define each term. Your own line's trend, measured under one consistent definition, is more useful in practice than comparisons with other companies or lines.
Separate Machine OEE from Line Output
Higher OEE on one machine does not always mean more output from the line. Line output is set by the bottleneck, the process with the lowest capacity. Raising capacity at a non-bottleneck machine just adds work in process.
Pushing OEE up when there is no demand backfires too: you overproduce, and inventory, storage, and handling costs grow. Use OEE first on machines whose output falls short and on bottleneck processes.
Track Planned Downtime with a Different Metric
Because OEE uses loading time as its denominator, it ignores how long planned stops last and any time the machine is not scheduled to run at all.
How well equipment uses total calendar time is usually tracked with a separate metric, TEEP (total effective equipment performance). TEEP is OEE multiplied by utilization, the share of all calendar time that is planned production time.
Before deciding to add equipment, look beyond OEE and check how much time could be recovered from planned stops and from periods when the equipment is not scheduled to run.
A practical way to start: align the definitions on one machine, then measure stops and actual cycle time for one week. Once you see where the numbers and the floor's sense of the line disagree, the next action is easier to choose.
Checklist: Before You Compare OEE with a Japanese Plant
Use this list when you take over an OEE report from a Japanese parent or sister plant, or before comparing your numbers with theirs.
- Same formula: availability × performance × quality rate, with the same definitions of operating time and good count
- Written list of planned stops subtracted from loading time (breaks, planned maintenance, meetings, and anything else)
- Loss list in use: 7 big losses, Six Big Losses, 8 losses, or a company-specific list
- Where cutting tool changes and startup losses are filed
- Time threshold separating minor stops from breakdowns
- Point where setup ends: last adjustment or first good part
- Source and date of the ideal cycle time for each product
- Whether reworked parts and startup defects count as good
- How stops are recorded: by hand, from machine signals, or both
- Production conditions shown with the numbers: product count, changeovers, output, staffing
- Any definition changes in the period, with old-basis and new-basis figures shown side by side
Questions to Ask the Japanese Side
- Which document defines your OEE: JIS Z 8141, JIPM material, or an internal standard? Can you share it?
- Which losses do you subtract as planned stops (keikaku teishi), and which count as stoppage losses?
- How many minutes of stop count as choko-tei (minor stop) rather than a breakdown?
- Do you treat startup loss as an availability loss or a quality loss?
- When was the ideal cycle time (kijun saikuru taimu) last reviewed, and on what basis?
- Is the good count first-pass good only, or does it include reworked parts?
- Which loss is the current improvement target on this line, who owns it, and when will the result be checked?
Where This Guide Does Not Apply
The formulas and loss lists here assume machining and assembly equipment. Process industries define the three factors differently. Loss boundaries, the minor-stop threshold, and the treatment of startup vary by company and industry, and the figures from Asahi Tekko and Keyence come from one company's experience and one worked example. Agree on definitions with the plant you work with before comparing numbers.
FAQ
What are the 7 big losses in TPM?
They are the seven equipment losses listed in JIS Z 8141: breakdowns, setup and adjustment, cutting tool change, startup, minor stops and idling, reduced speed, and defects and rework. Each one lowers availability, performance, or quality rate.
What is the difference between the 7 big losses and the Six Big Losses?
The seven-loss list counts cutting tool change and startup as separate losses. The common English Six Big Losses has no tooling category and treats startup defects as "reduced yield," a quality loss. Both rest on the same three groups: stoppage, performance, and defect losses.
Is OEE "overall equipment effectiveness" or "efficiency"?
Both names refer to the same metric. English sources mostly say effectiveness; JIS Z 8141 and JIPM use efficiency.
Why did our OEE drop after we fixed the data collection?
Better data often makes OEE fall, because losses that were hidden, such as short stops or a loose ideal cycle time, now show up. Report old-basis and new-basis figures side by side for a while.
Is 85% OEE a realistic target?
It is a high bar: 90% availability, 95% performance, and 99% quality rate give only 84.6%. Track your own line's trend under fixed definitions rather than chasing a universal benchmark.
Sources
- Definitions of OEE and the 7 big losses of equipment (terms 6501 and 6114): Japanese Standards Association, JIS Z 8141:2022 Production management terms (Japanese); text checked on a JIS viewer page (Japanese)
- TPM, the year it was proposed, and the term "overall equipment efficiency": Japan Institute of Plant Maintenance, "What Is TPM" (Japanese)
- Stop records, cycle times, line stop meetings, and results at Asahi Tekko: Information-technology Promotion Agency (IPA), DX SQUARE, Asahi Tekko case study, August 17, 2022 (Japanese)
- Characteristics of minor stops and the loss calculation: Keyence, "Causes of and Fixes for Minor Stops" (Japanese)
- Breakdown vs. minor stop thresholds, 8 equipment losses, and 16 big losses: JMA Consultants, TPM Online, "Loss Improvement 2: The 16 Big Losses" (Japanese)
- Three-factor formulas and the 85% benchmark: Nikken Total Sourcing, "What Is OEE?" (Japanese)
- Six Big Losses and TEEP: Vorne Industries, "Six Big Losses"; "TEEP"
Original article in JapaneseThis guide is adapted from a MONOSCOPE article written for readers in Japan: 設備総合効率(OEE)が上がらない原因|7大ロスの見える化と改善
About the editor
 MONOSCOPE EditorFOUNDER & EDITOR
Spent about ten years at a plant equipment maker and a plant engineering company, proposing, designing, and commissioning equipment, then moved into web marketing. Now a web consultant for B2B manufacturers, helping them explain their products and technology. Licensed in Japan as an Energy Manager and a Third-Class Chief Electrical Engineer.
Has run an engineering blog since 2017 (500+ articles) and a Japanese YouTube channel with about 20,000 subscribers. Each English guide is written from the Japanese shop-floor point of view and checked against the cited standards.