Where Japan Holds Top Global Share: Materials and Equipment
If you buy semiconductor materials, electronic components, or factory equipment, you have probably seen a Japanese supplier's slide that reads "No. 1 global share." Sometimes the claim checks out and the supplier really does make most of the world's supply. Sometimes it applies only to a narrow slice of the market. Either way, it tells you something about how many real alternatives you have.
The bigger picture is a paradox. Japanese companies' share of the world semiconductor market fell from 50.3% in 1988 to 10.0% in 2019. Yet in the materials and equipment used to make those chips, Japanese firms still lead product after product. This guide maps where Japan holds the top global share, product by product, using only figures the companies themselves or Japan's Ministry of Economy, Trade and Industry (METI) have published, each with its source and date. It then explains how to read these share claims and what they mean for sourcing.
This article looks at products and fields, mostly through large manufacturers. For mid-sized and small specialists, including METI's Global Niche Top program, see Hidden Champions in Japan: Global Niche Top Suppliers.
Contents
- Quick Reference: Products Where Japanese Companies Lead
- Why the Leaders Sit Upstream in the Supply Chain
- Semiconductors: Falling Chip Share, Strong Materials and Equipment
- Semiconductor Equipment and Materials: Who Leads in What
- Beyond Chips: Components, Machinery, and Materials
- How to Read a "No. 1 Global Share" Claim
- Why Japanese Suppliers Hold These Positions
- What This Means for Buyers and Engineers
- Limits of This List
- FAQ
- Sources
Quick Reference: Products Where Japanese Companies Lead
The table lists products for which a Japanese manufacturer publishes a world No. 1 position or an equivalent high share in its own materials. We left out figures that appear only in news articles or blogs. The colored tag shows who produced the number: the company's own estimate, a market research firm cited by the company, or a rank with no number.
The base year, unit count vs. revenue, and market definition differ from company to company, so do not compare the figures with each other. A 95% share in a narrow product and a 36% share in a broad category are not the same kind of number.
The leaders cluster in semiconductor equipment and materials, electronic components, machine components, and engineered materials.
| Field | Product | Company | Stated share | Basis and date |
|---|---|---|---|---|
| Chip equipment | Coater/developers for EUV lithography | Tokyo Electron | 100% | Company Integrated Report 2025 |
| Chip equipment | Dicing saws; grinders/polishers | DISCO | 70–80% | Company IR FAQ, "currently" (no year) |
| Chip equipment | Semiconductor test systems (ATE) | Advantest | 58% | Company CY2024; Investors' Guide, Oct. 2025 |
| Chip materials | Silicon wafers | Shin-Etsu Chemical | No. 1 | Rank only Integrated Report 2025 |
| Chip materials | Wafers for leading-edge logic | SUMCO | ≥50% | Company Website (no year) |
| Chip materials | Photoresist (all types) | Tokyo Ohka Kogyo (TOK) | 26.1% | Company Website; see Figure 5 |
| Chip materials | ABF build-up film (package substrates) | Ajinomoto | >95% | Company Since launch; briefing, June 2026 |
| Chip materials | Sputtering targets | JX Advanced Metals | ~65% | Company Website, "as of FY2026" |
| Chip materials | Die bonding film | Resonac | No. 1 | Research firm Fuji Keizai, 2024 sales volume |
| Electronic components | Multilayer ceramic capacitors (MLCC) | Murata Manufacturing | 40% | Company Website (no year) |
| Electronic components | HDD spindle motors | Nidec | 80% | Company Website (no year) |
| Electronic components | Photomultiplier tubes | Hamamatsu Photonics | ~90% | Company Website, "currently" (no year) |
| Machine components | Miniature/small ball bearings, OD 22 mm or less | MinebeaMitsumi | ≥60% | Company Company research |
| Machine components | Pneumatic equipment | SMC | ~36% | Company IR page (no year) |
| HVAC | Air-conditioning equipment (by revenue) | Daikin Industries | No. 1 | Research firm Fuji Keizai, 2024 results |
| Automotive parts | Spark plugs | Niterra | No. 1 | Rank only Company estimate, Mar. 31, 2025 |
| Measurement | Engine emission measurement systems | HORIBA | 80% | Company HORIBA Report 2024–2025 |
| Materials | Carrier-attached ultra-thin copper foil | Mitsui Kinzoku | ≥95% | Company Product page (no year) |
| Materials | Optical PVA film (LCD polarizers) | Kuraray | 80% | Company Estimate, as of Dec. 2025 |
Figures as published by each company or METI, checked in October 2026. Base year, unit vs. revenue basis, and market definition differ by company, so the figures cannot be compared with each other. Sources are listed at the end of this article.
Almost none of these are products you buy in a store. Most are materials and components that go inside other companies' products, or equipment used in factories. Daikin is the exception, leading in a product close to the finished good: commercial and residential air conditioners.
The list is not complete. It only includes products where we could find the company's own published claim. FANUC, known for CNC controls for machine tools and for industrial robots, describes its position as "world top class (company estimate)" in its Integrated Report 2024 without giving a number or a rank, so it is not in the table.
Related: FANUC Business Model: What It Means for Buyers and Users
Why the Leaders Sit Upstream in the Supply Chain
In this article, "downstream" means the finished products that reach consumers, and "upstream" means everything that feeds into them. Upstream covers three layers: raw and engineered materials, the production equipment that processes them, and the electronic and mechanical components built into the final product. Nearly every product in Figure 1 falls into one of these three layers.
The leading products are concentrated in the three upstream layers before the finished product.
Equipment is placed below materials because it turns materials into parts and devices.
Upstream products are rarely visible to consumers, but finished-goods makers find them hard to replace. Multilayer ceramic capacitors (MLCCs) are a good example. A smartphone or car uses many of these tiny parts, and making them involves hard-to-copy know-how at every step, from mixing the ceramic powders to firing.
Related: MLCC Manufacturing Process: Why Japanese Makers Lead
Semiconductors: Falling Chip Share, Strong Materials and Equipment
Semiconductors show Japan's upstream tilt most clearly. METI's Semiconductor Strategy outline, published in March 2021, put numbers on the shift.
Chip Sales Share: From 50.3% to 10.0%
According to METI, Japanese companies held 50.3% of world semiconductor sales in 1988. In the 1992 sales ranking, six of the top 10 chipmakers were Japanese: NEC, Toshiba, Hitachi, Fujitsu, Mitsubishi, and Matsushita. By 2019, Japan's share had fallen to 10.0%, and Kioxia was the only Japanese company left in the top 10. Behind the decline were the rise of Korean and Taiwanese companies and the spread of the fabless–foundry model, which separates chip design from manufacturing.
Measured by chip sales, Japan's weight fell sharply in three decades.
Source: METI, Semiconductor Strategy outline (March 2021), based on Omdia data. 2019 shares: US 50.7%, Asia 25.2%.
Equipment and Materials: Japanese Firms Still Hold Large Shares
The same METI document describes semiconductor equipment and materials as fields where Japan "has strengths." Using Nomura Securities data, it puts the share held by Japanese companies at about 90% for coaters, about 70% for resist, about 80% for encapsulants (the resin that seals and protects a chip), and about 60% for silicon wafers. METI also called these strengths "chokepoints" in the global semiconductor supply chain.
In coaters, encapsulants, and resist, Japanese firms hold well over half the market.
Source: METI, Semiconductor Strategy outline (March 2021), based on Nomura Securities data. CVD equipment deposits thin films; etch equipment removes film to form circuit patterns.
Japan did not retreat from every chip category, either. The same METI document, citing Omdia's 2019 data, shows Sony with 54% of the CMOS image sensor market, the sensors used in smartphone cameras and similar devices.
Related: Semiconductor Back-End Process: Flow and Japanese Suppliers
Semiconductor Equipment and Materials: Who Leads in What
Equipment: Coating, Dicing, and Testing
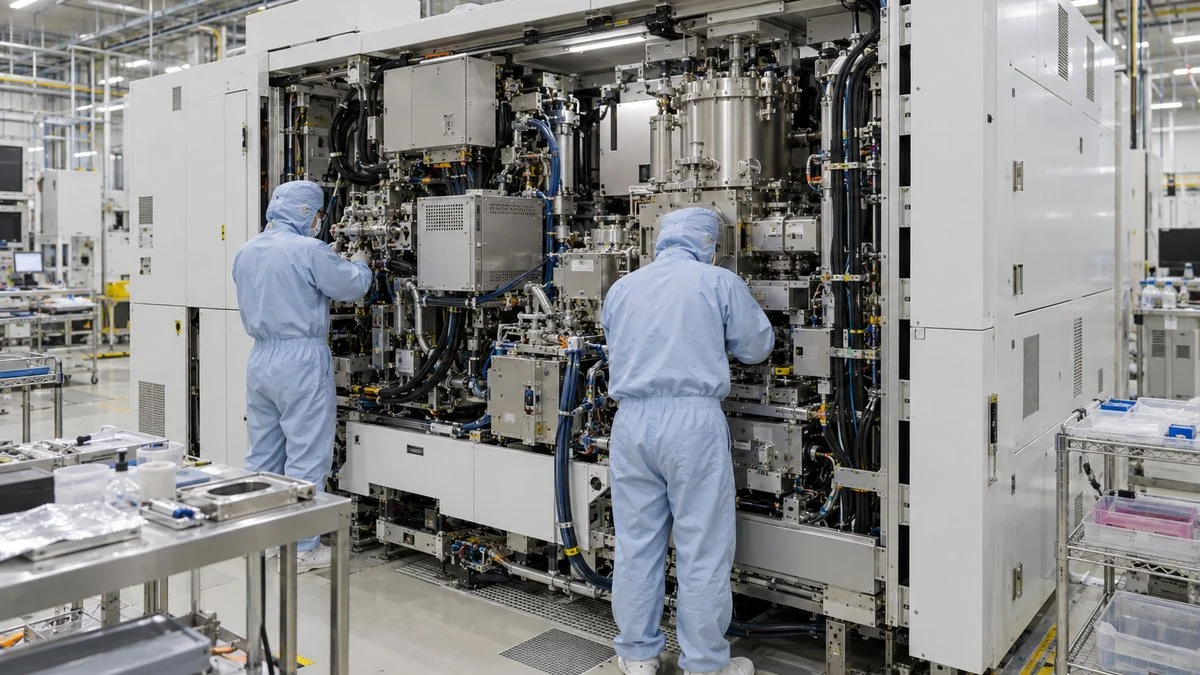
- Coater/developers (Tokyo Electron): These tools coat a wafer with photoresist and develop it after exposure. Tokyo Electron's Integrated Report 2025 claims a 100% share (company estimate) of coater/developers for EUV (extreme ultraviolet) lithography, the most advanced exposure process. Note how narrow that market is: EUV tools only.
- Dicing saws and grinders (DISCO): DISCO specializes in cutting wafers into individual chips and thinning wafers by grinding and polishing. Its IR FAQ says it currently sees its global share at 70–80% for both product lines.
- Test systems (Advantest): Advantest makes the automated test equipment (ATE) that checks whether finished chips work. Its October 2025 Investors' Guide gives a 58% share of the whole tester market for CY2024, with 63% in memory testers and 56% in SoC testers.
Materials: Wafers, Resist, Substrate Film, and Targets
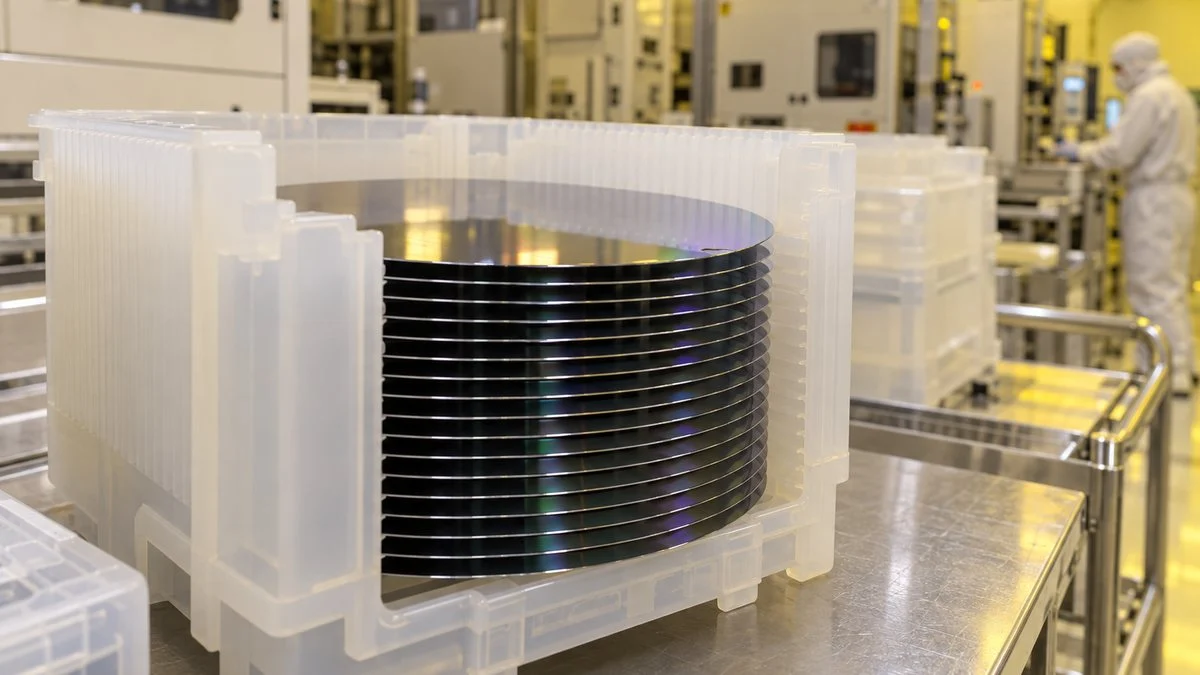
- Silicon wafers (Shin-Etsu Chemical, SUMCO): Shin-Etsu's Integrated Report 2025 lists semiconductor silicon (silicon wafers) as a world No. 1 product, along with PVC resin. SUMCO states a share of at least 50% in wafers for leading-edge logic chips (processors).
- Photoresist (TOK): Tokyo Ohka Kogyo reports a 26.1% share of all semiconductor photoresist and calls itself the global No. 1. Figure 5 below shows how that number changes by exposure type.
- ABF build-up film (Ajinomoto): Better known as a food company, Ajinomoto makes Ajinomoto Build-up Film, the insulating film between layers of a chip package substrate. The product grew out of chemistry from its amino acid research. In a June 2026 briefing, the company said ABF has kept a share above 95% since launch.
- Sputtering targets (JX Advanced Metals): These metal plates supply the material for thin films such as chip wiring. The company's website shows a global share of about 65%, labeled "as of FY2026," a mid-year figure. It does not name a research firm or say whether the share is by volume or value.
- Die bonding film (Resonac): Citing Fuji Keizai, Resonac reports the world's No. 1 sales volume in 2024 for this film, which attaches chips to substrates.
Many of these materials makers belong to Japan's chemical industry.
Related: Japanese Chemical Industry: Supply Chain and Trading Houses
Beyond Chips: Components, Machinery, and Materials
Electronic Components: MLCCs, Motors, and Light Sensors
- MLCCs (Murata Manufacturing): Murata is the largest maker of these capacitors, which store charge and stabilize voltage in electronic circuits. Its business page puts its MLCC market share at 40% and states a policy of staying the top-share supplier.
- HDD spindle motors (Nidec): Nidec's website claims an 80% world share of the motors that spin hard disk platters.
- Photomultiplier tubes (Hamamatsu Photonics): These tubes turn extremely weak light into an amplified electrical signal. Hamamatsu states a global share of about 90%. They are used in medical diagnostic equipment and particle physics detectors.
Machinery and Factory Automation: Bearings, Pneumatics, HVAC
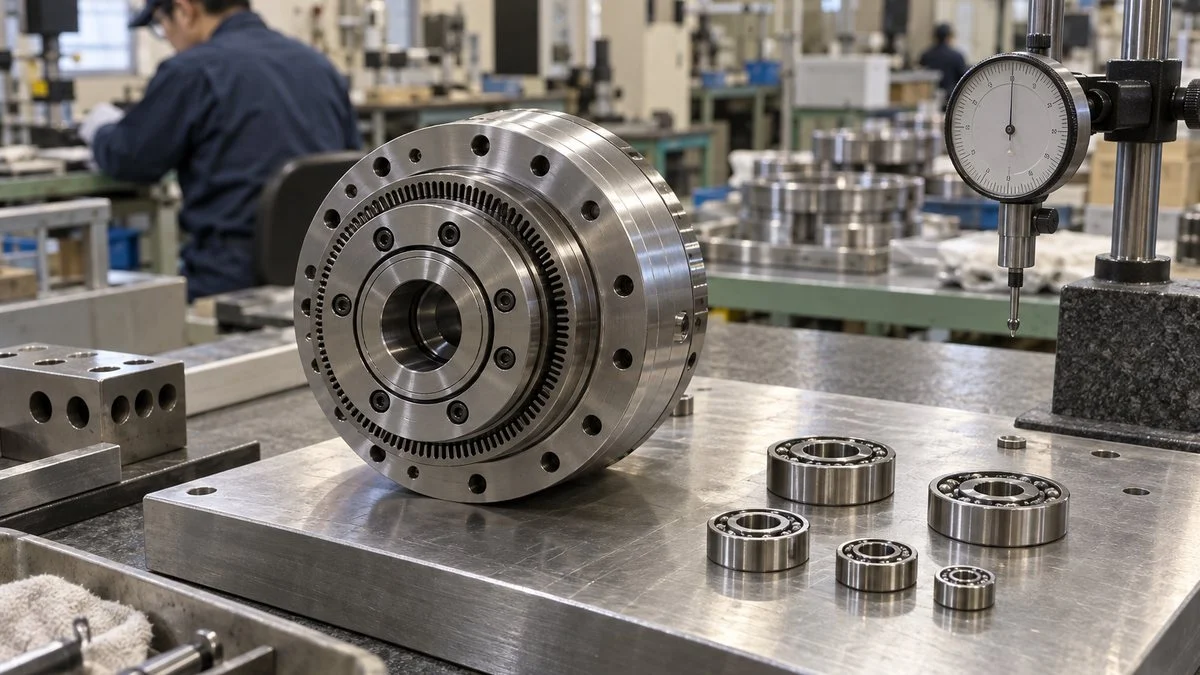
- Miniature ball bearings (MinebeaMitsumi): The company reports a world share of at least 60% for miniature and small-diameter ball bearings with an outer diameter of 22 mm (0.87 in) or less, based on its own research.
- Pneumatic equipment (SMC): SMC makes cylinders, valves, and other equipment that move machines with compressed air. Its IR page gives a global sales share of about 36% and a 62% share in Japan. For the wider factory automation landscape, see Japanese Factory Automation Companies: Who Makes What.
- Air conditioning (Daikin Industries): Citing Fuji Keizai, Daikin says it ranked first worldwide in air-conditioning equipment revenue in 2024.
Automotive Parts, Measurement, and Engineered Materials
- Spark plugs (Niterra): Niterra, formerly NGK Spark Plug, reports the No. 1 global share in spark plugs (company estimate as of March 31, 2025). Its group company pages also describe its oxygen sensors as world No. 1. No share figure is published for either product, and the oxygen sensor claim carries no date.
- Emission measurement systems (HORIBA): HORIBA's integrated report, HORIBA Report 2024–2025, shows an 80% global share for its engine exhaust gas measurement systems, noted as a company estimate.
- Ultra-thin copper foil (Mitsui Kinzoku): Its carrier-attached ultra-thin copper foil, used to form fine circuits on chip package substrates, carries a stated global share of 95% or more on the product page.
- Optical PVA film (Kuraray): Kuraray estimates an 80% share (as of December 2025) for optical polyvinyl alcohol (PVA) film, a base film for the polarizers in LCD panels.
- Carbon fiber (Toray): Toray's June 2026 business briefing shows a 28% share of all carbon fiber, a material lighter and stronger than steel that is used in aircraft structures and wind turbine blades. The briefing gives no rank, so Toray is not in Figure 1.
How to Read a "No. 1 Global Share" Claim
The same product can show very different share figures depending on how the share is counted. Before you rely on a supplier's number, check three things.
1. Units or Revenue?
Share can be counted by units or weight shipped (volume basis) or by sales revenue (value basis). A company selling large volumes of low-priced products looks stronger on a volume basis; a company focused on high-priced products looks stronger on a value basis.
2. Which Market?
Next, look at how the market is defined. TOK's 26.1% covers all semiconductor photoresist. On the same page, citing Fuji Chimera Research Institute (2025 estimate, shipment volume basis), TOK breaks the market down by exposure type: 33.3% for KrF and 29.3% for EUV. The narrower the slice, the bigger the share tends to look. When you see "100% in a specific application," ask how large that application is within the whole market.
TOK's global share in semiconductor photoresist (by exposure type: 2025 estimate, shipment volume basis)
Source: TOK, "TOK at a Glance" page. The four exposure-type figures are from Fuji Chimera Research Institute, as cited by TOK. The page gives no source note for the overall 26.1%.
3. Who Estimated It, and When?
A company's own estimate is usually calculated over the market it can see. A research firm's figure follows the firm's own market definition. The date matters just as much: actual vs. forecast, and which year. In cyclical fields such as semiconductors, rankings can change within one or two years. Many company overview pages do not date their share figures, which is why Figure 1 marks them "no year."
Why Japanese Suppliers Hold These Positions
Japan lost ground in several finished products, so why do its upstream suppliers keep their lead? The explanations companies give tend to fall into three groups.
Technology, how customers buy, and the nature of the market reinforce each other.
Shaped by Demanding Customers
Japan's electronics and automotive makers grew large at home. Their parts and materials suppliers refined low-variation materials and precision processing to meet those customers' strict quality requirements. Technology proven with domestic customers later won over customers abroad, a pattern shared by many of the companies in Figure 1.
Related: Monozukuri Meaning: Japan’s Philosophy of Making Things
Hard to Replace Once Qualified
Semiconductor materials and electronic components only deliver their performance once they are built into the customer's product or process. Switching to another supplier means repeating prototyping, evaluation, and quality qualification, so a qualified product tends to stay in use for a long time. Ajinomoto's statement that ABF has held more than 95% since launch is one example. Staying involved from the customer's early development stage, so the next product generation also qualifies, is part of how these suppliers keep the top spot.
Small Markets Where Specialists Go Deep
Many of these product markets are not large. For a big conglomerate, entering may not pay off, while a specialist can go deep into one technology. Reinvesting high profits in R&D and equipment widens the gap with later entrants. Mid-sized niche leaders work the same way; see our hidden champions guide.
What This Means for Buyers and Engineers
A top share is a useful sign of a supplier's technical strength. It also points to concentration risk. When most of the world's supply of a material comes from one company, or from plants in one country, a disaster or a demand spike can tighten supply for everyone. METI's 2021 document described the equipment and materials where Japan is strong as "chokepoints" in the global chip supply chain. For the trade side of this risk, see US Tariffs on Japanese Imports in 2026.
Checklist: Before You Rely on a Top-Share Supplier
- The share basis: units or revenue, which market segment, whose estimate, and which year
- Whether the segment in the claim matches your application (for example, EUV-only vs. all photoresist)
- Where the product is made: number of plants and countries
- Whether a second source exists, and how long qualifying it would take in your process
- Lead time today and during the last supply shortage
- How much notice the supplier gives for product changes or discontinuation (PCN/EOL)
- Who you buy through: direct, a Japanese trading company, or a local distributor
Questions to Ask the Japanese Supplier
- What is the basis of the share figure in your materials (volume or value, market definition, source, year)?
- Which plants make the grade we use, and is any other plant qualified to make it?
- What is your business continuity plan if the main plant stops?
- How far in advance will you notify us of process, material, or site changes?
- Can you support local stock or consignment inventory in our region?
A short inquiry you can adapt:
Subject: Supply information request for [product name / grade]
We are evaluating [product] for [application] at our plant in [country]. Could you share (1) the plants that produce this grade, (2) the standard and shortest lead times, (3) your change-notification policy, and (4) whether a local distributor or stock program is available? We would also appreciate the source and year behind the market share figure in your brochure.
For how RFQs and supplier evaluation usually run with Japanese manufacturers, see RFQ to a Japanese Manufacturer and Japanese Procurement: QCD Negotiation and Supplier Ratings.
Limits of This List
- It includes only products where we found a claim in the company's own materials or a METI document. Many Japanese top-share products, especially from mid-sized and small companies, are not here.
- Share figures are self-reported or cited by the company. We did not verify them against independent market data, and several pages give no year.
- The METI shares for equipment and materials are from a 2021 document and may have changed since.
- Shares and rankings change, especially in semiconductors. Check the latest company reports before using any figure in a purchasing decision.
FAQ
What products does Japan have the largest global market share in?
Mostly upstream products: semiconductor materials (silicon wafers, photoresist, ABF film, sputtering targets), semiconductor equipment (EUV coater/developers, dicing saws, test systems), electronic components (MLCCs, HDD spindle motors, photomultiplier tubes), and machine components (miniature bearings, pneumatic equipment). Figure 1 lists the figures with sources.
Which Japanese companies lead in semiconductor materials?
Based on their own published figures: Shin-Etsu Chemical and SUMCO in silicon wafers, Tokyo Ohka Kogyo in photoresist, Ajinomoto in ABF build-up film, JX Advanced Metals in sputtering targets, Resonac in die bonding film, and Mitsui Kinzoku in ultra-thin copper foil for package substrates.
How much of the semiconductor market does Japan have?
For chips themselves, METI put Japanese companies at 10.0% of world semiconductor sales in 2019, down from 50.3% in 1988. In equipment and materials the shares are much higher; METI cited about 90% for coaters and about 70% for resist.
Is a "100% share" claim real?
It can be, but check the segment it covers. Tokyo Electron's 100% applies to coater/developers for EUV lithography only, not to all coater/developers, and it is a company estimate. Always check the market definition and the source.
Sources
- Japan semiconductor share, equipment and materials shares, Sony CMOS share: METI, Semiconductor Strategy outline, March 2021 (Japanese)
- Tokyo Electron: Integrated Report 2025, Chapter 2
- DISCO: IR FAQ (Japanese)
- Advantest: Investors' Guide, October 2025 (Japanese)
- Shin-Etsu Chemical: Integrated Report 2025, Introduction (Japanese)
- SUMCO: Growth strategy (Japanese)
- Tokyo Ohka Kogyo: TOK at a Glance (Japanese)
- Ajinomoto: Electronic materials business briefing, June 30, 2026 (Japanese)
- JX Advanced Metals: JX at a Glance (Japanese)
- Resonac: Resonac Now, September 1, 2025 (Japanese)
- Murata Manufacturing: Capacitor business (Japanese)
- Nidec: NIDEC, No.1 (Japanese)
- Hamamatsu Photonics: At a Glance (Japanese)
- MinebeaMitsumi: Ball bearings: why customers choose us (Japanese)
- SMC: SMC at a Glance (Japanese)
- Daikin Industries: Daikin in Numbers (Japanese)
- FANUC: Integrated Report 2024 (Japanese)
- Niterra: Niterra in Numbers, recruiting site (Japanese)
- HORIBA: HORIBA Report 2024–2025
- Kuraray: IR: Market share (Japanese)
- Mitsui Kinzoku: MicroThin carrier-attached ultra-thin copper foil (Japanese)
- Toray: Carbon fiber composite materials business briefing, June 2026 (Japanese)
Original article in JapaneseThis guide is adapted from a MONOSCOPE article written for readers in Japan: 世界シェアトップの日本の製造業|部材・装置で首位の企業と製品一覧
About the editor
 MONOSCOPE EditorFOUNDER & EDITOR
Spent about ten years at a plant equipment maker and a plant engineering company, proposing, designing, and commissioning equipment, then moved into web marketing. Now a web consultant for B2B manufacturers, helping them explain their products and technology. Licensed in Japan as an Energy Manager and a Third-Class Chief Electrical Engineer.
Has run an engineering blog since 2017 (500+ articles) and a Japanese YouTube channel with about 20,000 subscribers. Each English guide is written from the Japanese shop-floor point of view and checked against the cited standards.